Most of the carbon is locked in before anyone moves in
A building's biggest emissions are embodied in its materials, decided at procurement, not in the energy bill later. Turning a bill of quantities and supplier EPDs into a number you can defend is mostly data work, done before any report. The analyst does that work and shows the factor behind every line.
You stay the reviewer
A bill of quantities in, an upfront-carbon number out
The calculation is simple: quantity times factor. The work is the document grind, reading the bill of quantities and finding the right EPD for the actual product a supplier used, not a generic default. The analyst matches each line to its EPD or approved factor and shows the source, so a NABERS or Green Star assessor can follow it.
Emissions line
Concrete, 40 MPa, ground floor slab, 620 m³
Result
198 t CO₂e
How the analyst got there
Source
Bill of quantities, 620 m³ (≈ 1,488 t)
Emission factor
Supplier EPD, 40 MPa mix: 133 kg CO₂e/t (upfront, A1–A3)
Reasoning
Purchased material → embodied carbon. EPD-specific, not a default.
Bringing experience with SME to Enterprise







99.95%
Calculation accuracy
EPD-backed
Material factors
30 min
Average processing time
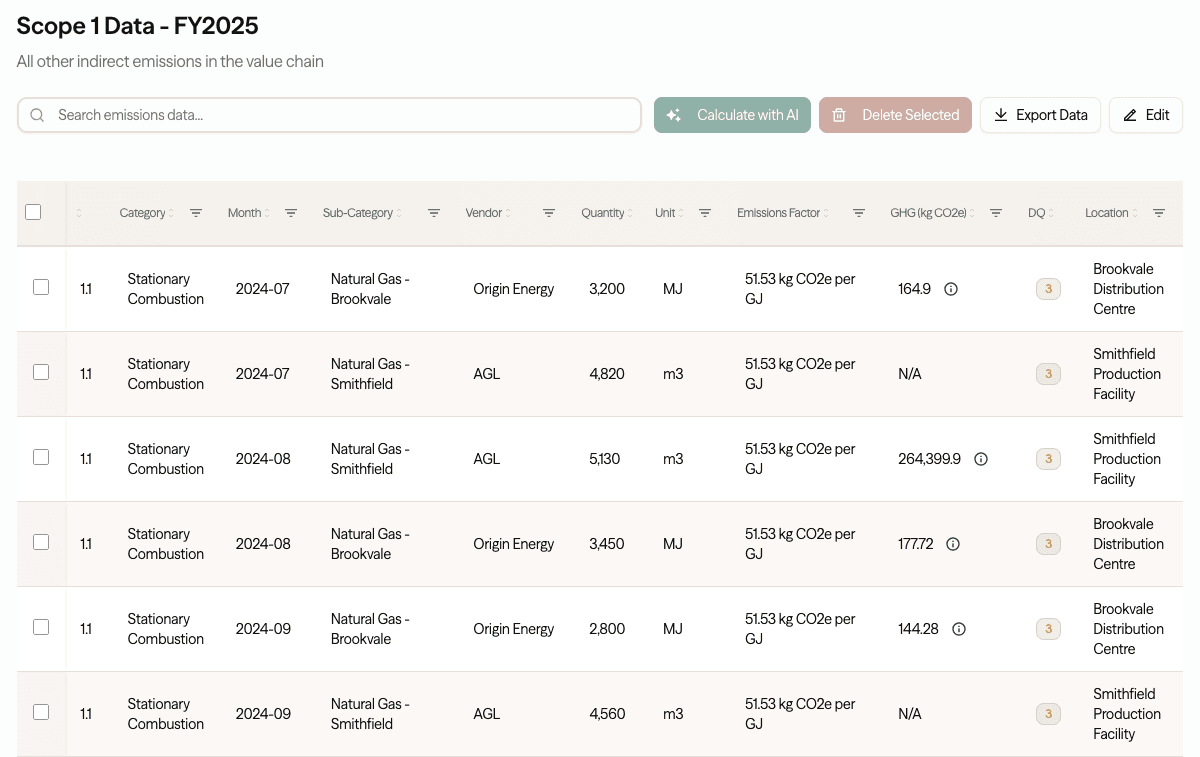
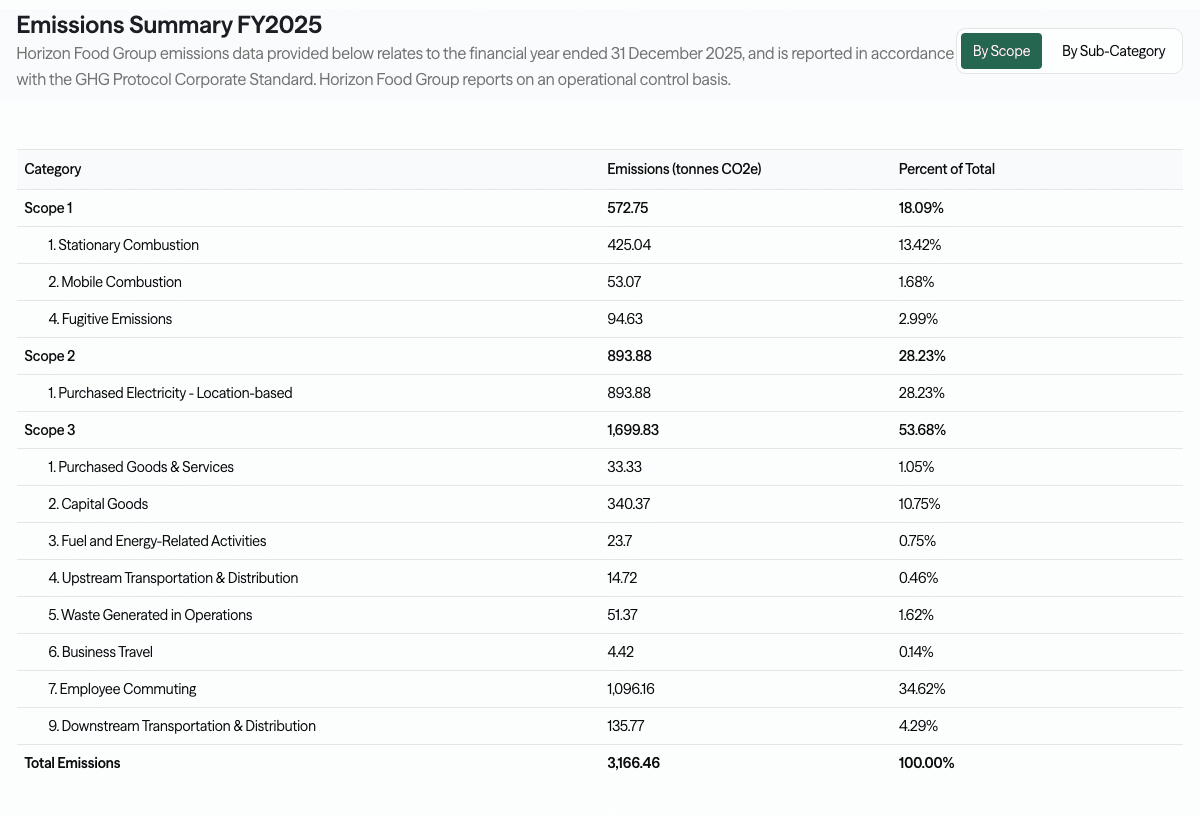
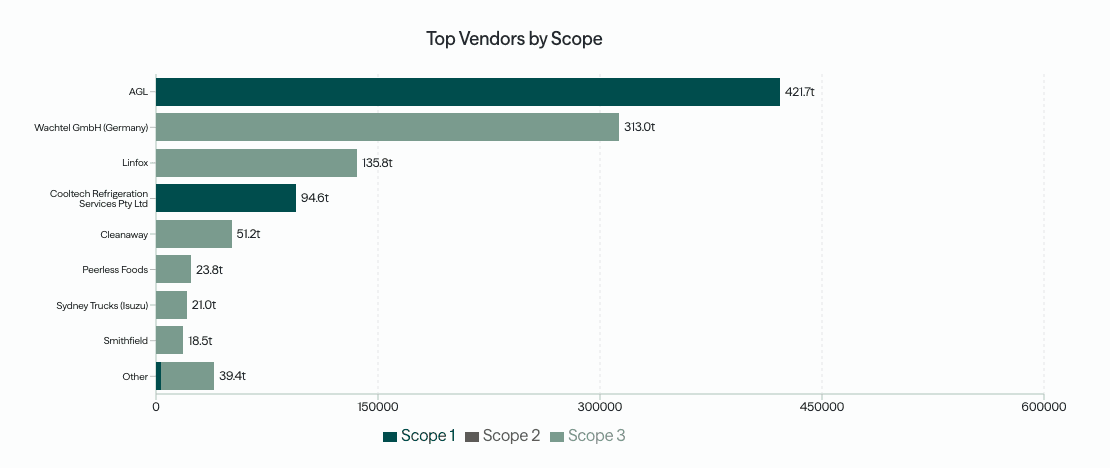 Every number traced to source
See a finished inventory, every number traced to its source
A completed, ASRS-ready example. Every figure linked back to its source document, emissions factor, and reasoning.
Tell us about your team and we'll walk you through this example.
How it works
Drop in your bill of quantities, supplier EPDs, plant fuel logs and site energy bills, the analyst calculates each scope with matched factors, and you report per project or consolidated across your projects.
See the full process →Embodied carbon
Materials
Concrete and steel dominate the upfront carbon of most projects, and the cement in concrete is the hotspot. CO2 Lab reads your bill of quantities and applies EPD-specific factors, so a lower-clinker mix or a recycled-content steel shows up in the number instead of hiding behind an average.
Quantities from the bill of quantities
EPD-specific factors for concrete, steel, aluminium
Upfront carbon (A1–A5), reported by stage
Low-clinker and recycled-content mixes reflected
Plant and equipment fuel on site
Subcontractor invoices and spend
Site electricity and temporary power
Activity-based where you have it, spend-based where you do not
Scope 1, 2 & 3 · Site
Site & subcontractors
Construction (stage A5) adds plant fuel, temporary power and a long tail of subcontractor spend. CO2 Lab reads the invoices and fuel logs you already hold and turns them into a categorised, factor-backed number that withstands assurance.
Operational carbon
In-use energy
Once occupied, a building's carbon is its energy. CO2 Lab extracts consumption from utility bills across a portfolio and calculates location-based and market-based Scope 2 side by side, so a GreenPower or PPA claim keeps its evidence attached to the figure.
Electricity and gas per asset
Location- and market-based Scope 2
GreenPower and PPA claims with evidence attached
Whole-life carbon alongside upfront
Frequently asked questions
Every material, every scope, one footprint
A free 30-minute chat, no obligation, on where you stand ahead of your first ASRS report.
Book a Sustainability Check-upWhere to go next
Spend vs activity-based
Which method to use where, and why it changes your Scope 3.
IndustryManufacturing
Process, energy and materials, the factor shown per line.
IntegrationXero
Pull subcontractor and materials spend straight from your accounts.
ComplianceASRS by group
Your reporting group, start date and disclosure requirements.