Every source has a different factor
Process emissions, purchased energy, raw materials, freight: every source needs the right factor, and getting each one correct is the hard part, long before you write a report. The analyst does that work from your fuel logs, utility bills and production records, and shows the factor behind every line.
You stay the reviewer
A number your auditor can follow
The analyst shows which factor it used, its source, and why, per line. Location-based and market-based Scope 2 sit side by side, so a GreenPower or PPA claim keeps its contractual evidence attached to the figure.
Emissions line
Natural gas, Plant 2 boiler, Q3
Result
0.94 t CO₂e
How the analyst got there
Source
Origin invoice, 18,400 MJ
Emission factor
NGA 2024, natural gas: 0.0513 kg CO₂e/MJ
Reasoning
Stationary combustion → Scope 1. Activity-based: metered MJ.
Bringing experience with SME to Enterprise







99.95%
Calculation accuracy
Multi-site
Facility tracking
30 min
Average processing time
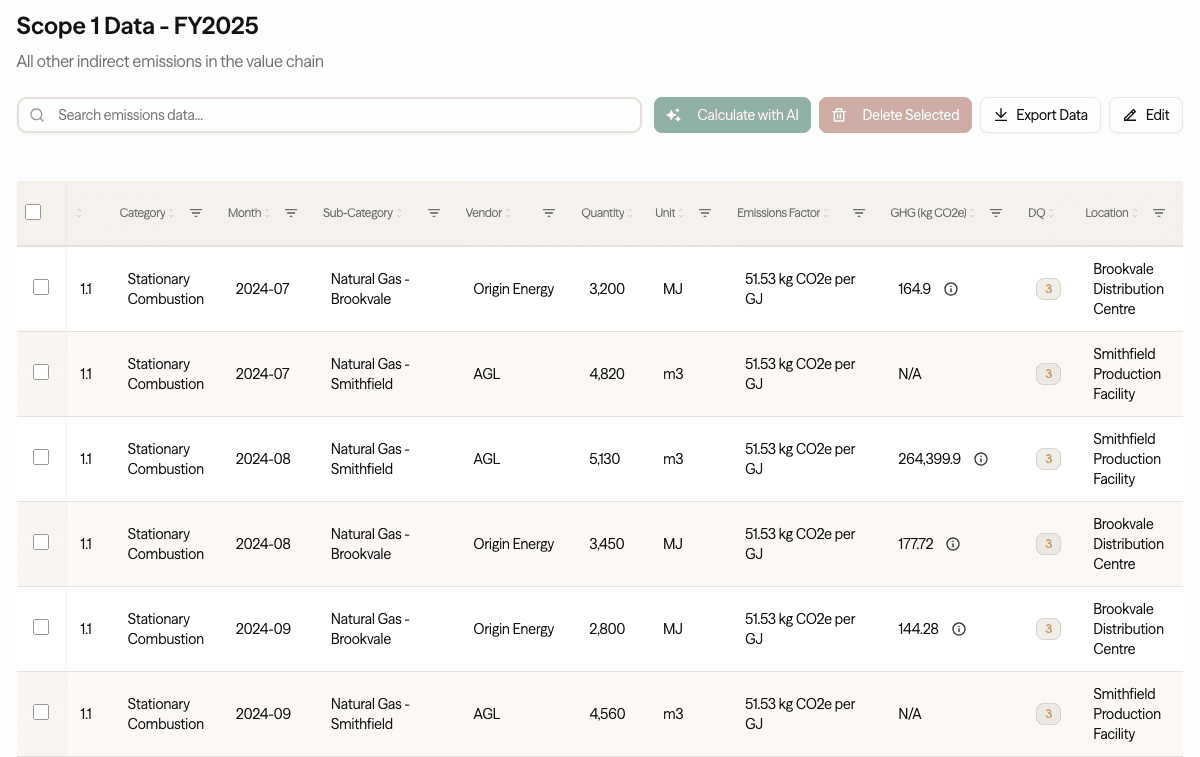
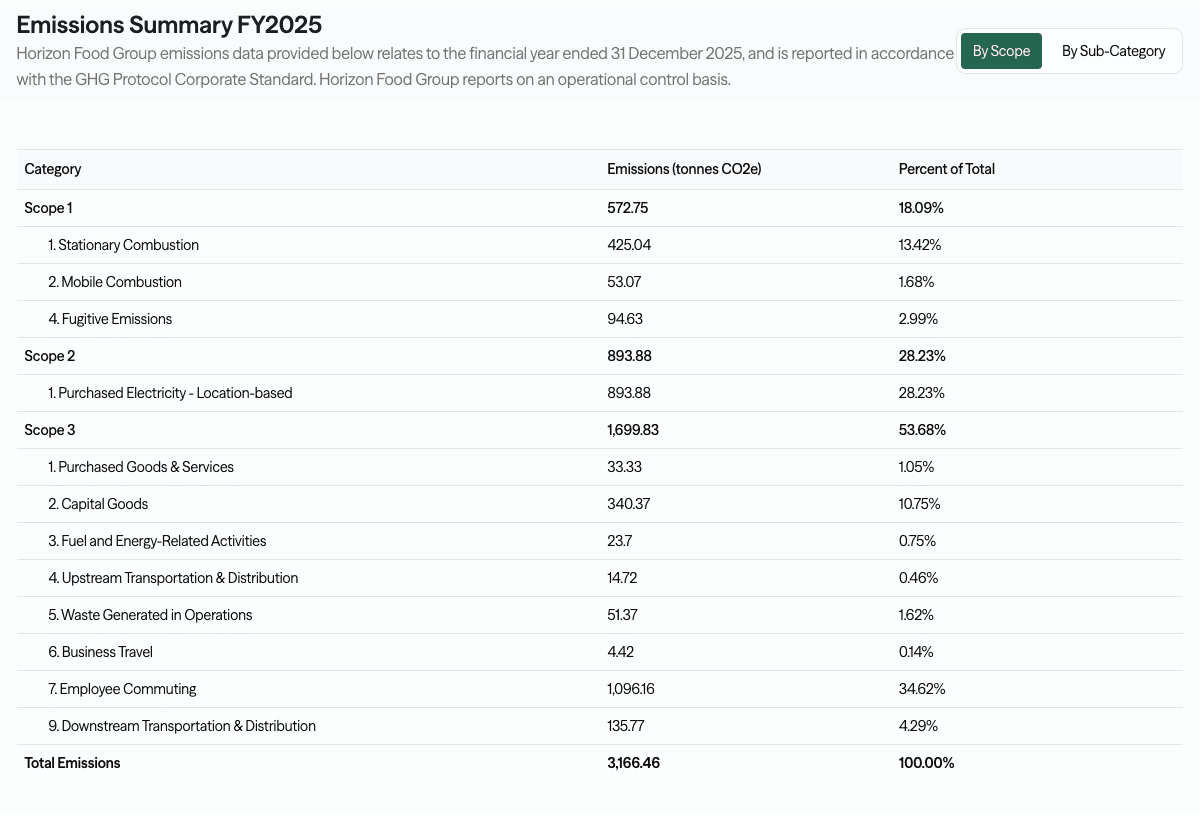
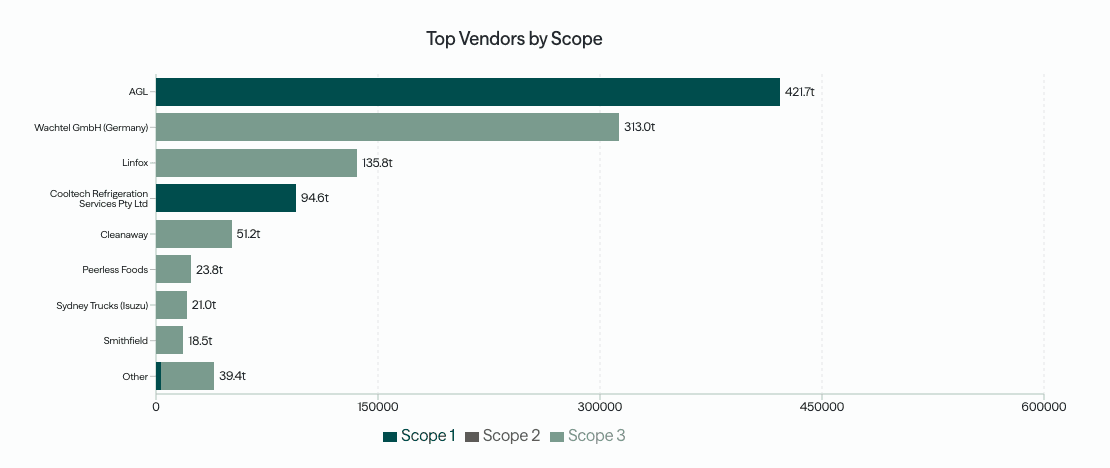 Every number traced to source
See a finished inventory, every number traced to its source
A completed, ASRS-ready example. Every figure linked back to its source document, emissions factor, and reasoning.
Tell us about your team and we'll walk you through this example.
How it works
Drop in fuel logs, utility bills and production records, the analyst calculates each scope with matched factors, and you report per site or consolidated across operations.
See the full process →Scope 1
Process emissions tracking
From combustion and chemical processes to fugitive emissions, CO2 Lab handles the full range of manufacturing Scope 1 sources. Upload fuel logs and production records, and our AI calculates emissions with industry-specific factors.
Stationary combustion from boilers and furnaces
Process emissions from chemical reactions
Fugitive emissions from refrigerants and gases
Mobile combustion from fleet and plant equipment
Electricity consumption per facility
Natural gas and steam usage
Renewable energy tracking and offsets
Year-on-year energy intensity trends
Scope 2
Energy consumption monitoring
Track electricity, gas, and steam across every facility. Our AI extracts data from utility bills automatically and calculates both location-based and market-based Scope 2 emissions.
Scope 3
Supply chain emissions
Raw materials, freight, and distribution make up the bulk of most manufacturers' footprint. CO2 Lab maps your upstream and downstream emissions using both activity-based and spend-based methods.
Raw material and purchased goods emissions
Upstream and downstream transportation
Waste generated in operations
End-of-life treatment of sold products
Frequently asked questions
Every site, every scope, one footprint
A free 30-minute chat, no obligation, on where you stand ahead of your first ASRS report.
Book a Sustainability Check-upWhere to go next
Logistics
Fleet fuel and subcontracted freight, reported per route.
CompareConsultant vs software
Why a reviewable tool beats a report you can only take on faith.
IntegrationNetSuite
Pull supplier spend straight from your ERP for Scope 3.
ComplianceASRS by group
Your reporting group, start date and disclosure requirements.