Your footprint is in the ingredients
Dairy, meat, grains, oils: most of a food footprint is the ingredients, and each carries a different farm-gate factor. Getting that right is a data job first, a reporting one second. The analyst does that work from your bill of materials, and shows the factor behind every line.
You stay the reviewer
The method behind every number
Beef, dairy, wheat and palm oil are worlds apart. The analyst matches a factor to each purchased ingredient, shows its source and reasoning, and keeps activity-based and spend-based methods clearly labelled so you know exactly how each number was built.
Emissions line
Raw milk, Q3 intake, 84,000 L
Result
112.6 t CO₂e
How the analyst got there
Source
Supplier statement, 84,000 L (≈ 86,520 kg)
Emission factor
AusLCI, raw milk at farm gate: 1.30 kg CO₂e/kg
Reasoning
Purchased agricultural input → Scope 3, Cat 1. Activity-based: measured litres.
Bringing experience with SME to Enterprise







99.95%
Calculation accuracy
Ingredient-level
Input tracking
30 min
Average processing time
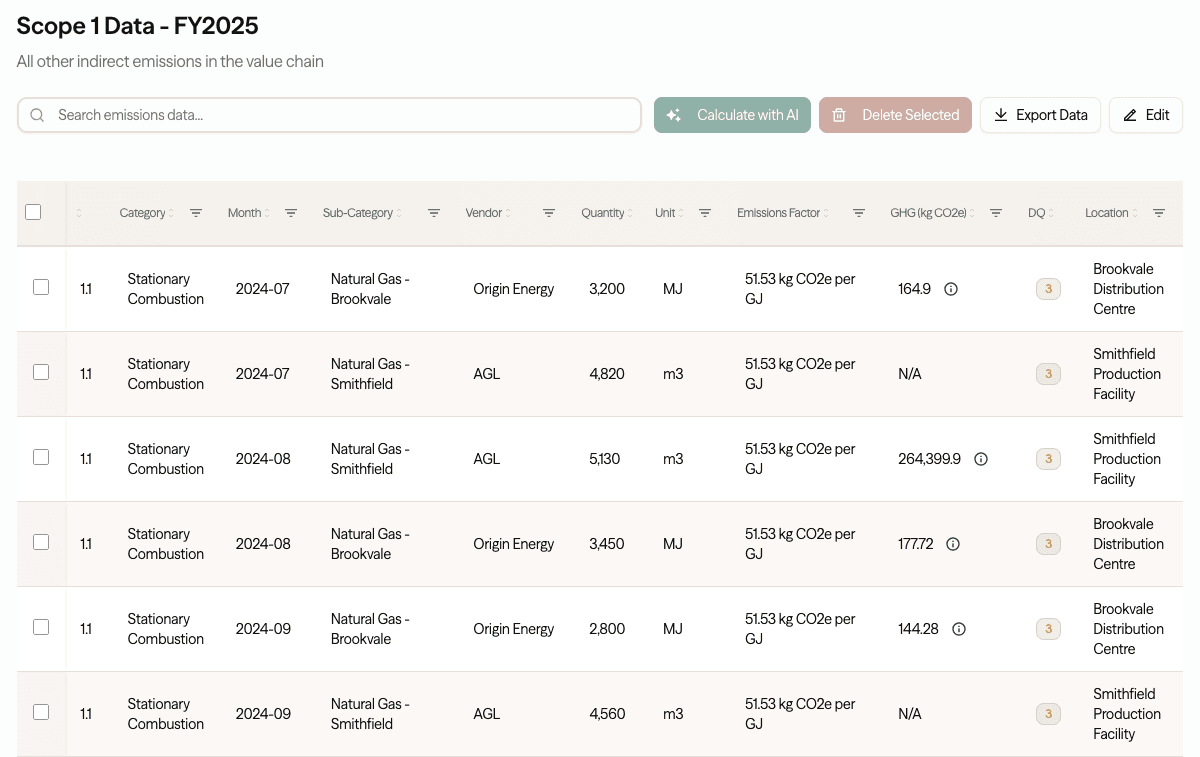
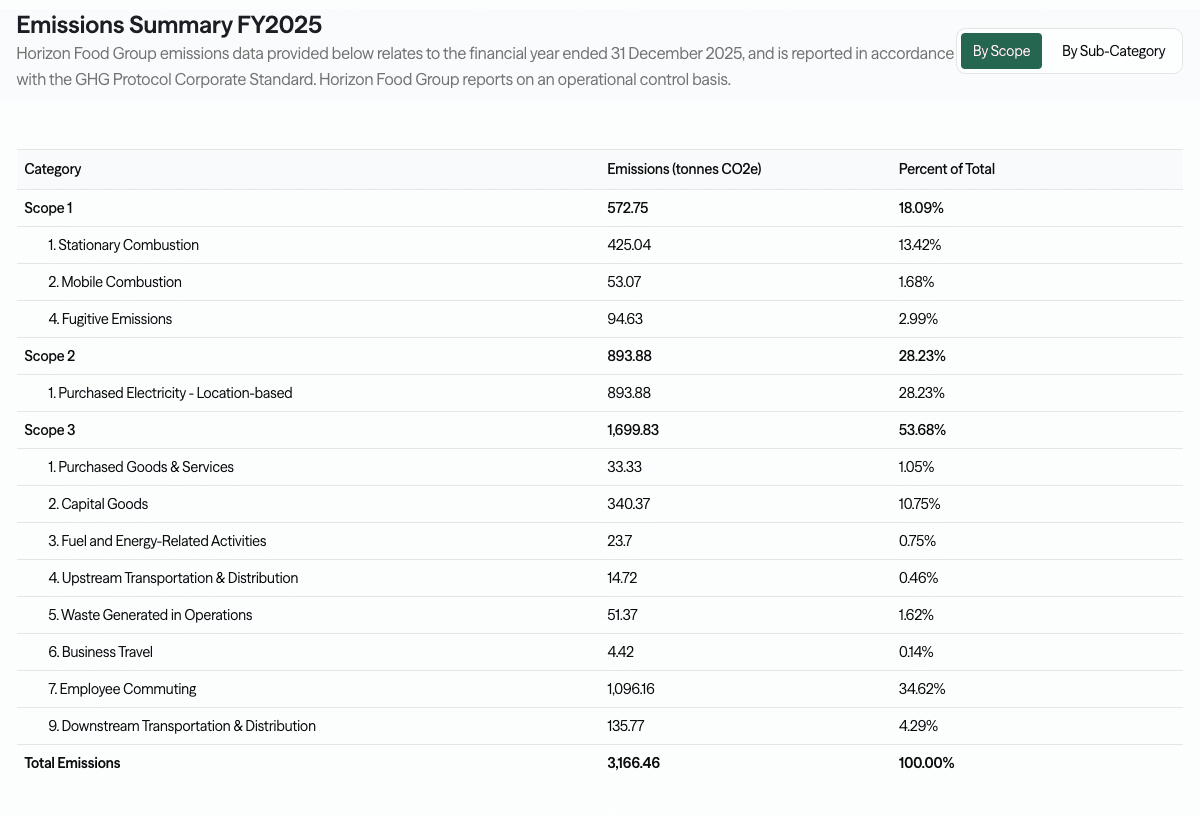
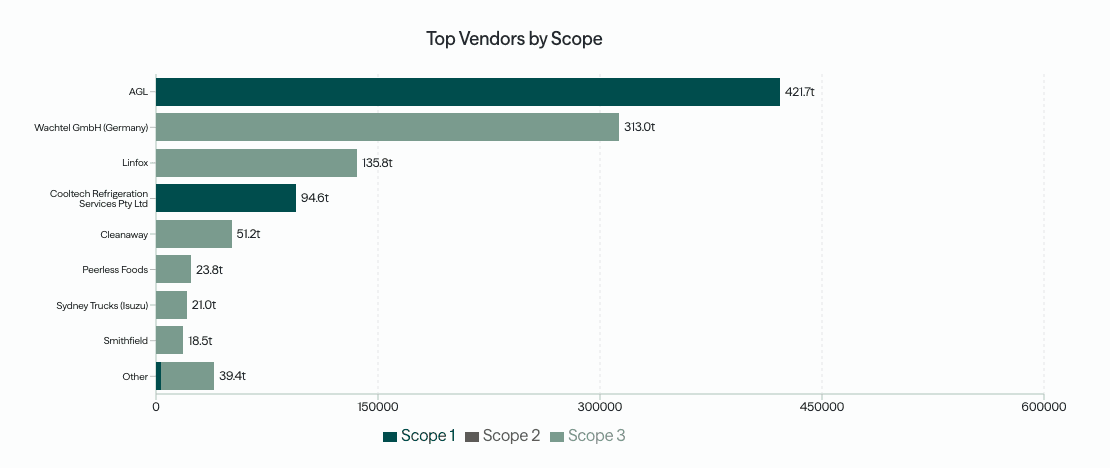 Every number traced to source
See a finished inventory, every number traced to its source
A completed, ASRS-ready example. Every figure linked back to its source document, emissions factor, and reasoning.
Tell us about your team and we'll walk you through this example.
How it works
Drop in ingredient purchases, utility bills, freight docs and packaging specs, the analyst calculates each scope with matched factors, and you report per product, per site or consolidated across the business.
See the full process →Scope 3 · Ingredients
Farm-gate inputs
Dairy, meat, grains, sugar and oils dominate a food footprint, and their hotspots differ: enteric fermentation for livestock, fertiliser and land-use change for crops. CO2 Lab reads your bill of materials and applies a farm-gate factor to each input, so a change in sourcing or recipe moves the number.
Farm-gate factors from AusLCI and Agri-footprint
Enteric fermentation and manure management for livestock
Activity-based from purchase quantities, spend-based fallback
Recipe and sourcing changes reflected per product
Process heat, steam and refrigeration
Fugitive F-gas emissions from refrigerant leakage (Scope 1)
Electricity per plant, location- and market-based
Refrigerated freight and cold-chain distribution
Scope 1 & 2 · Processing
Processing & cold chain
Cooking, chilling and refrigeration are energy-intensive, and refrigerant leaks are a real Scope 1 source. The analyst extracts consumption from utility bills, accounts for fugitive refrigerant emissions, and follows the cold chain through to distribution.
Scope 3 · Packaging & waste
Packaging & waste
Glass, aluminium, board and plastic packaging each carry their own factor, and food waste in operations counts too. CO2 Lab maps packaging by material and weight and captures operational waste, so the full lifecycle is on the ledger.
Packaging by material: glass, aluminium, board, plastic
Material- and weight-specific factors
Food and organic waste in operations
End-of-life treatment of packaging
Frequently asked questions
Every ingredient, every scope, one footprint
A free 30-minute chat, no obligation, on where you stand ahead of your first ASRS report.
Book a Sustainability Check-upWhere to go next
Retail
Thousands of SKU spend lines into a defensible Scope 3.
CompareConsultant vs software
Why a reviewable tool beats a report you can only take on faith.
IntegrationXero
Pull supplier spend straight from your accounts for Scope 3.
ComplianceASRS by group
Your reporting group, start date and disclosure requirements.