The carbon is in the goods on the shelf
Thousands of SKUs, thousands of suppliers, and the footprint is in all of them. Turning that ledger into a number you can defend is data work at scale, before any report gets written. The analyst does that work and shows the factor behind every line.
You stay the reviewer
A spend ledger in, a defensible Scope 3 out
On day one the only complete data most retailers have is a giant purchase ledger, thousands of SKUs and suppliers. Mapping every line to the right factor by hand is slow and hard to defend. The analyst does the mapping, shows the factor and reasoning per line, and hands you a footprint you can review and stand behind under AASB S2.
Emissions line
Purchased goods, packaged snacks category, FY spend
Result
1,240 t CO₂e
How the analyst got there
Source
Purchase ledger, $1.86M category spend
Emission factor
EEIO, food manufacturing: 0.67 kg CO₂e/$ (spend-based)
Reasoning
Goods for resale → Scope 3, Cat 1. Spend-based until supplier data arrives.
Bringing experience with SME to Enterprise







99.95%
Calculation accuracy
SKU-level
Spend mapping
30 min
Average processing time
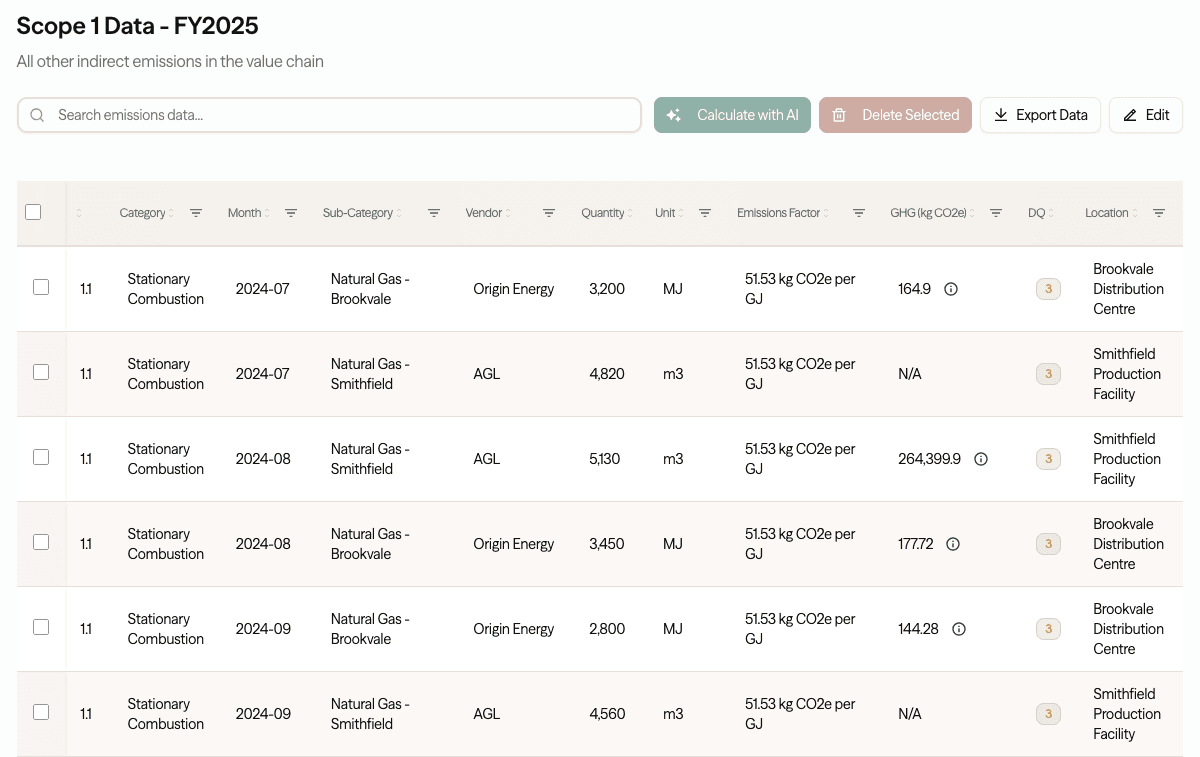
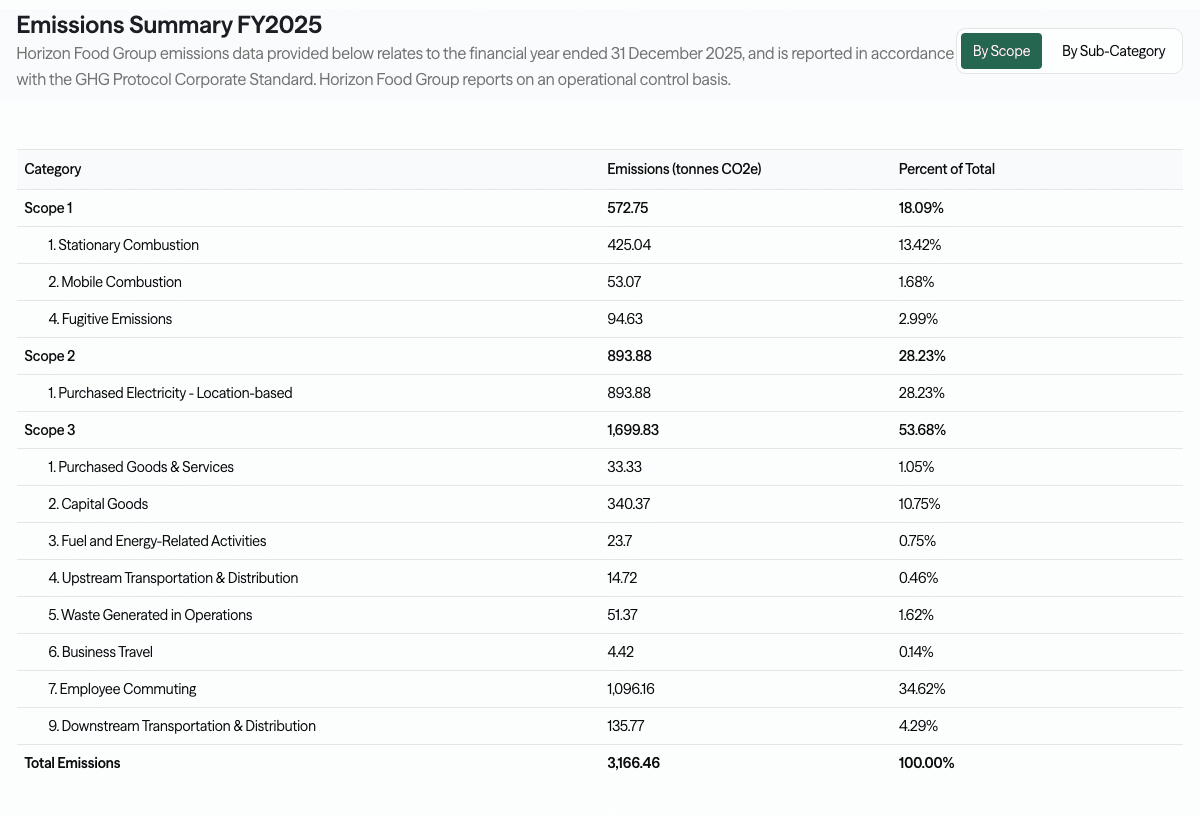
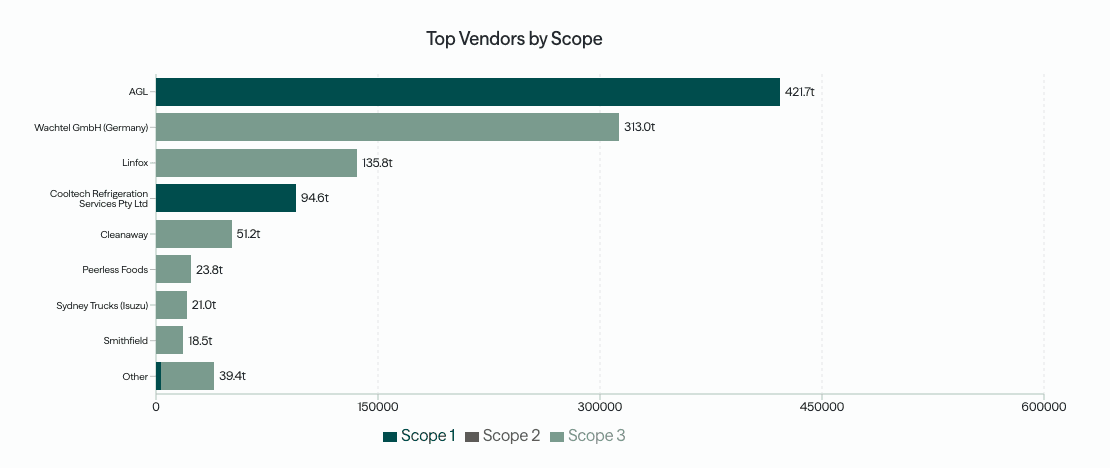 Every number traced to source
See a finished inventory, every number traced to its source
A completed, ASRS-ready example. Every figure linked back to its source document, emissions factor, and reasoning.
Tell us about your team and we'll walk you through this example.
How it works
Drop in purchase and supplier-spend data, store energy bills and refrigerant logs, the analyst calculates each scope with matched factors, and you report per category, per store or consolidated across the business.
See the full process →Scope 3 · Category 1
Purchased goods for resale
Goods for resale are the bulk of a retail footprint. CO2 Lab starts spend-based for full coverage using EEIO factors, then upgrades line by line to supplier-specific data as it arrives, so the number gets more precise without the model breaking or the audit trail resetting.
Spend-based coverage from your purchase ledger
Upgrade to supplier-specific data line by line
Primary and secondary data clearly labelled
Category, brand and supplier breakdowns
Electricity per store and distribution centre
Fugitive F-gas from refrigeration
Location- and market-based Scope 2
Inbound freight and distribution
Scope 1, 2 & 3 · Operations
Stores & refrigeration
Store energy is your Scope 2, and for grocery, refrigerant leakage is a real Scope 1 source that audits often flag. CO2 Lab extracts consumption from utility bills per site, captures fugitive F-gas, and follows inbound freight through to the store.
Supplier data
From spend to primary data
The majors are already pushing this: Coles has committed to have 75% of its suppliers by spend set science-based targets by 2027, and Woolworths was the first Australian retailer with SBTi-endorsed targets. As your suppliers return primary data, CO2 Lab swaps it in per line and keeps the provenance intact.
Track each line as primary or secondary data
Swap spend-based to activity-based as data arrives
Provenance kept on every upgrade
Report progress on data quality over time
Frequently asked questions
Every SKU, every scope, one footprint
A free 30-minute chat, no obligation, on where you stand ahead of your first ASRS report.
Book a Sustainability Check-upWhere to go next
Logistics
Fleet fuel and subcontracted freight, reported per route.
GuideA customer asked for your data
What to send when a retailer asks a supplier for emissions.
IntegrationNetSuite
Pull supplier spend straight from your ERP for Scope 3.
ComplianceASRS by group
Your reporting group, start date and disclosure requirements.