Take control of your Scope 3 emissions
Scope 3 is the biggest and messiest part of most footprints. Forward what suppliers already send you; the analyst categorises it across all 15 categories and ranks it by impact.
Bringing experience with SME to Enterprise








Supplier data collection shouldn't take months
Endless email chains chasing supplier data
Automated extraction from forwarded invoices
Inconsistent formats across your supply chain
AI normalises data from any document type
Limited visibility into upstream emissions
Full Scope 3 category breakdown with hotspots
No idea which suppliers to prioritise
Ranked by emissions impact and data quality
You stay the reviewer
Every supplier line, traceable
Each Scope 3 figure shows the method behind it: activity-based where a supplier gave you real data, spend-based where all you have is an invoice total, plus the factor and its source. When a number looks off, you can see whether it's the data or the method, not just accept it.
Emissions line
Packaging supplier, Q3 spend
Result
17.9 t CO₂e
How the analyst got there
Source
Invoice total, $42,600
Emission factor
EEIO, paper & packaging: 0.42 kg CO₂e/$
Reasoning
No activity data → spend-based. Scope 3, Category 1.
80%
Less time on data collection
15
Scope 3 categories covered
800k+
Emission factors
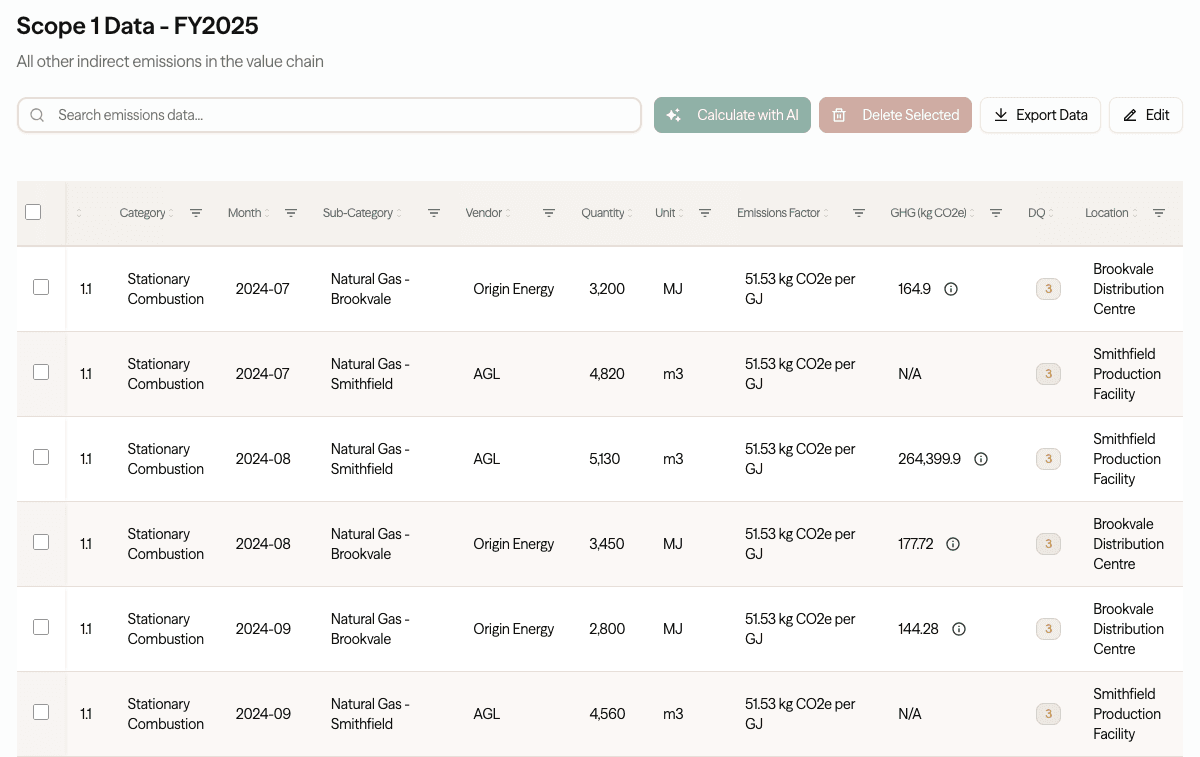
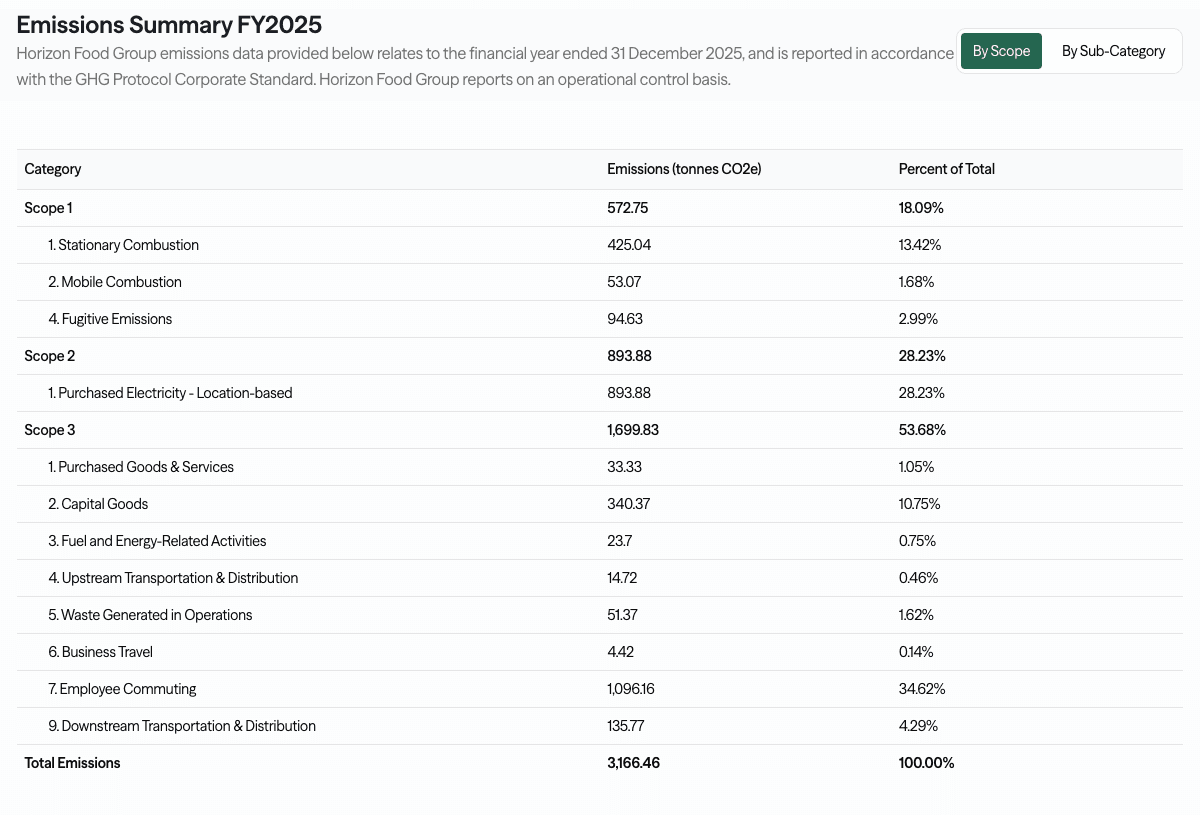
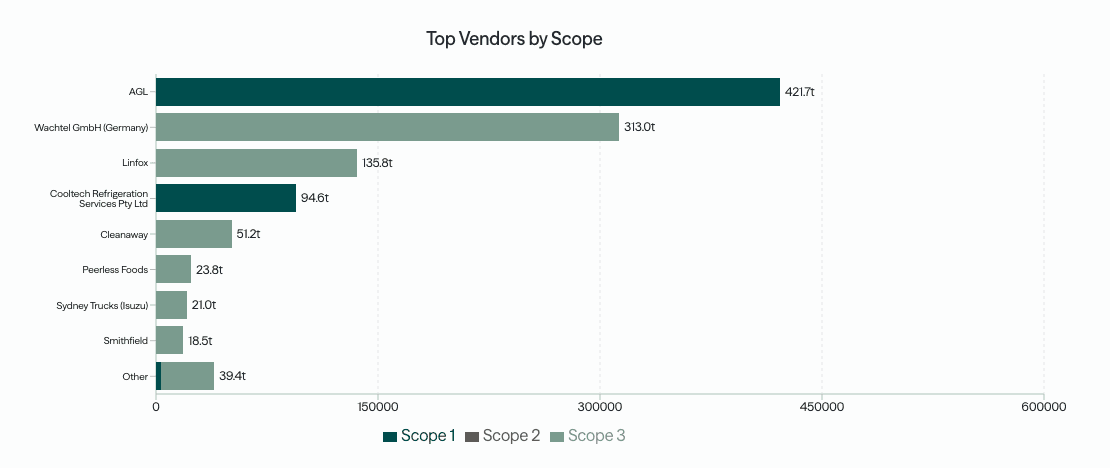 Every number traced to source
See a finished inventory, every number traced to its source
A completed, ASRS-ready example. Every figure linked back to its source document, emissions factor, and reasoning.
Tell us about your team and we'll walk you through this example.
How it works
Forward supplier invoices and correspondence, the analyst maps each across the 15 Scope 3 categories with matched factors, and you see which suppliers drive the most emissions.
See the full process →Made for messy supplier data
Whether you deal with 10 suppliers or 10,000, it works from the data you can actually get, and sharpens as better data arrives.
Extraction from supplier invoices and reports, in any format
Spend-based and activity-based calculation methods, shown per line
Supplier emissions profiling and hotspot analysis
Ranking by both emissions impact and data quality
Progress tracking across your entire supply chain
Frequently asked questions
See your supply chain, ranked
A free 30-minute chat, no obligation, on where you stand ahead of your first ASRS report.
Book a Sustainability Check-upWhere to go next
A customer asked for your data
What to send when a buyer requests your emissions, and how.
MethodologySpend vs activity-based
Why supplier data quality changes which method you use.
IntegrationXero
Pull a year of supplier spend in one click for Scope 3.
ComplianceASRS by group
When Scope 3 becomes mandatory for your reporting group.