Your emissions are in the fuel, and the trucks you hire in
A freight footprint lives in fuel, and in the carriers you subcontract, and the evidence is scattered across depots and formats. Turning it into a per-route number you can defend is a data problem first. The analyst does that work from your fuel-card and telematics data, and shows the factor behind every line.
You stay the reviewer
Fuel-card data in, a defensible per-route number out
The evidence is scattered: fuel-card exports, telematics feeds and consignment records, in different formats across every depot. The analyst reconciles litres to each vehicle, matches the right factor, and produces a per-route footprint with the source, factor and reasoning shown, so it holds up when an assurer asks.
Emissions line
Diesel, B-double linehaul Sydney–Melbourne, March
Result
2.65 t CO₂e
How the analyst got there
Source
Fuel-card export, 988 L diesel
Emission factor
NGA 2025, diesel: 2.68 kg CO₂e/L (Scope 1 combustion)
Reasoning
Own-fleet combustion → Scope 1. Activity-based: metered litres.
Bringing experience with SME to Enterprise







99.95%
Calculation accuracy
Per-route
Emissions tracking
30 min
Average processing time
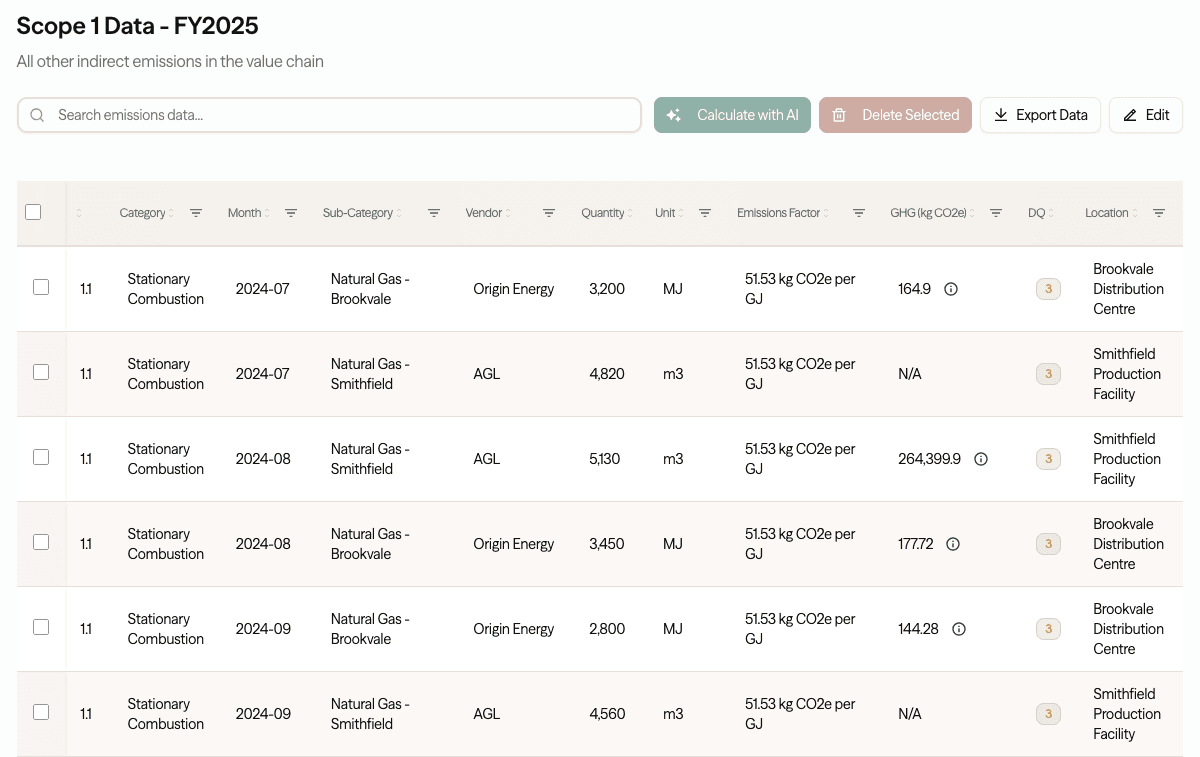
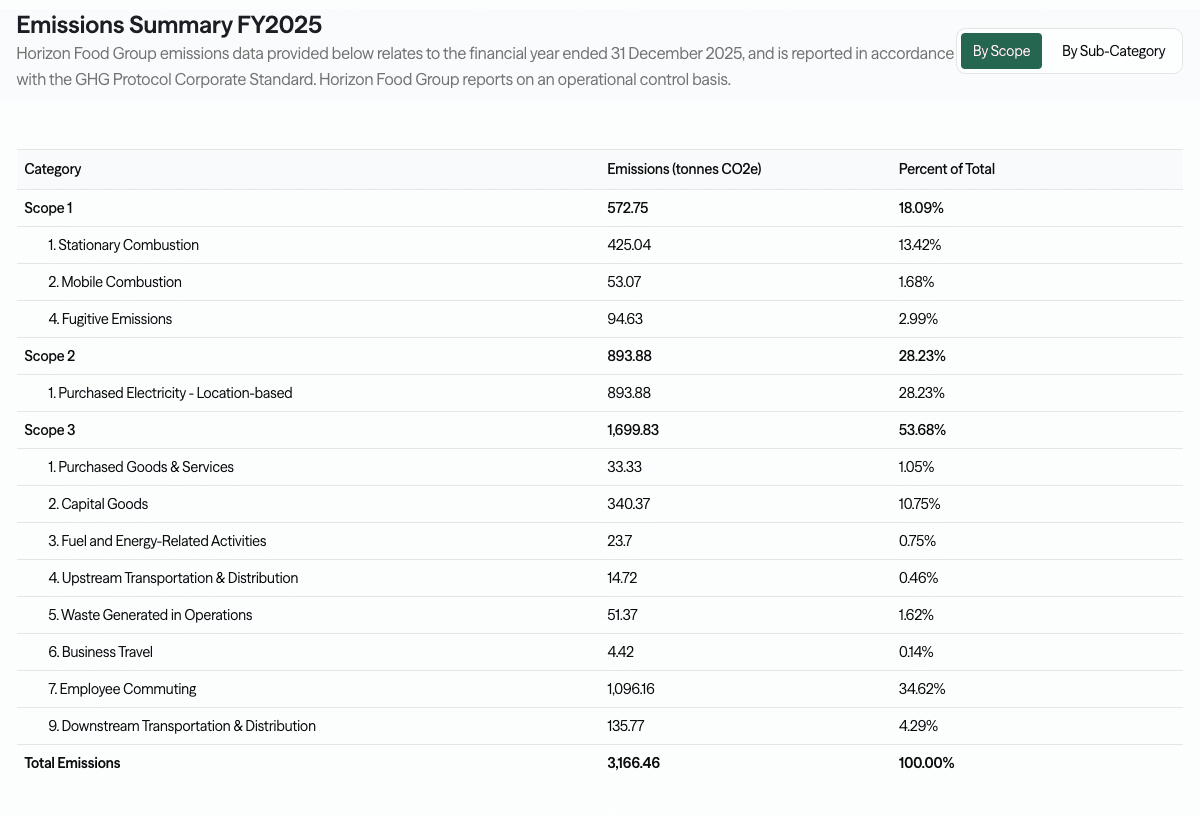
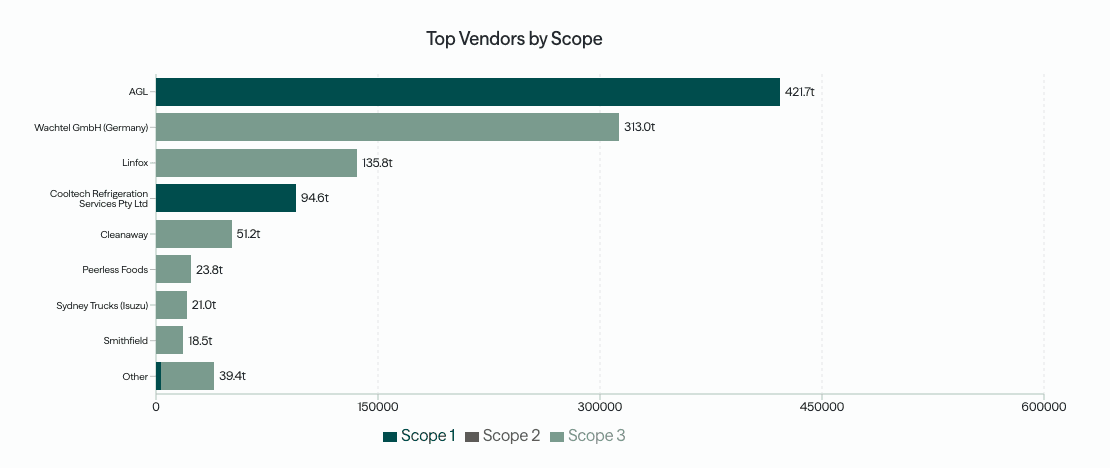 Every number traced to source
See a finished inventory, every number traced to its source
A completed, ASRS-ready example. Every figure linked back to its source document, emissions factor, and reasoning.
Tell us about your team and we'll walk you through this example.
How it works
Drop in fuel-card exports, telematics and consignment data, the analyst calculates each scope with matched factors, and you report per route, per depot or consolidated across the network.
See the full process →Scope 1 · Own fleet
Fleet fuel
For a carrier that runs its own trucks, fuel is the footprint. CO2 Lab reads fuel-card and telematics data per vehicle, applies the current NGA factor for each fuel and blend, and reports emissions on a well-to-wheel basis rather than tailpipe only.
Litres per vehicle from fuel cards and telematics
Diesel, biodiesel blends and renewable diesel (HVO)
Well-to-wheel, not tailpipe only
Emissions per tonne-kilometre by route
Subcontracted line-haul and last-mile
Weight, distance and mode from consignments
GLEC and ISO 14083 default intensities
Primary and default data clearly labelled
Scope 3 · Category 4
Subcontracted freight
Most operators move a lot of freight on other people's trucks, and rarely get fuel data back. When the carrier stays silent, CO2 Lab takes the consignment data you do have (weight, distance, mode) and applies GLEC and ISO 14083 intensities, flagging exactly where the number is a default rather than measured.
Intensity
Load and empty running
Two trucks burning the same diesel can carry very different footprints per tonne moved. CO2 Lab reports emissions per tonne-kilometre, so a better load factor or a backhaul that cuts empty running shows up as a real reduction, not a rounding difference.
Emissions per tonne-kilometre by lane
Load factor and empty running
Backhaul and consolidation gains
Reefer and cold-chain surcharges
Frequently asked questions
Every route, every scope, one footprint
A free 30-minute chat, no obligation, on where you stand ahead of your first ASRS report.
Book a Sustainability Check-upWhere to go next
Spend vs activity-based
Which method to use where, and why it changes your Scope 3.
IndustryManufacturing
Process, energy and materials, the factor shown per line.
IntegrationXero
Pull fuel and subcontractor spend straight from your accounts.
ComplianceASRS by group
Your reporting group, start date and disclosure requirements.