On a farm, most of the carbon comes from livestock and fertiliser
On a farm, most of the carbon never comes out of a tailpipe. It comes from the herd and from the nitrogen you put on the ground, both of which are modelled rather than read off a meter. The analyst works them out on the NGER method, alongside the diesel and electricity that are easier to measure.
You stay the reviewer
Farm records in, a defensible on-farm number out
The inputs are the ordinary records of the farm: fertiliser invoices, head counts, fuel deliveries and power bills. The analyst takes what you have, applies the NGER method and the right default factors, and gives you an on-farm number you can stand behind when a buyer or an assurer asks how it was built.
Emissions line
Urea applied to pasture, season total
Result
4.16 t CO₂e
How the analyst got there
Source
Farm records, 1,000 kg of applied nitrogen
Emission factor
IPCC default 1% N → N₂O-N, N₂O GWP 265 (NGER, AR5 basis)
Reasoning
Direct soil N₂O → Scope 1. Modelled on the default factor, not measured, and flagged as such.
Bringing experience with SME to Enterprise








99.95%
Calculation accuracy
Per-enterprise
Emissions tracking
30 min
Average processing time
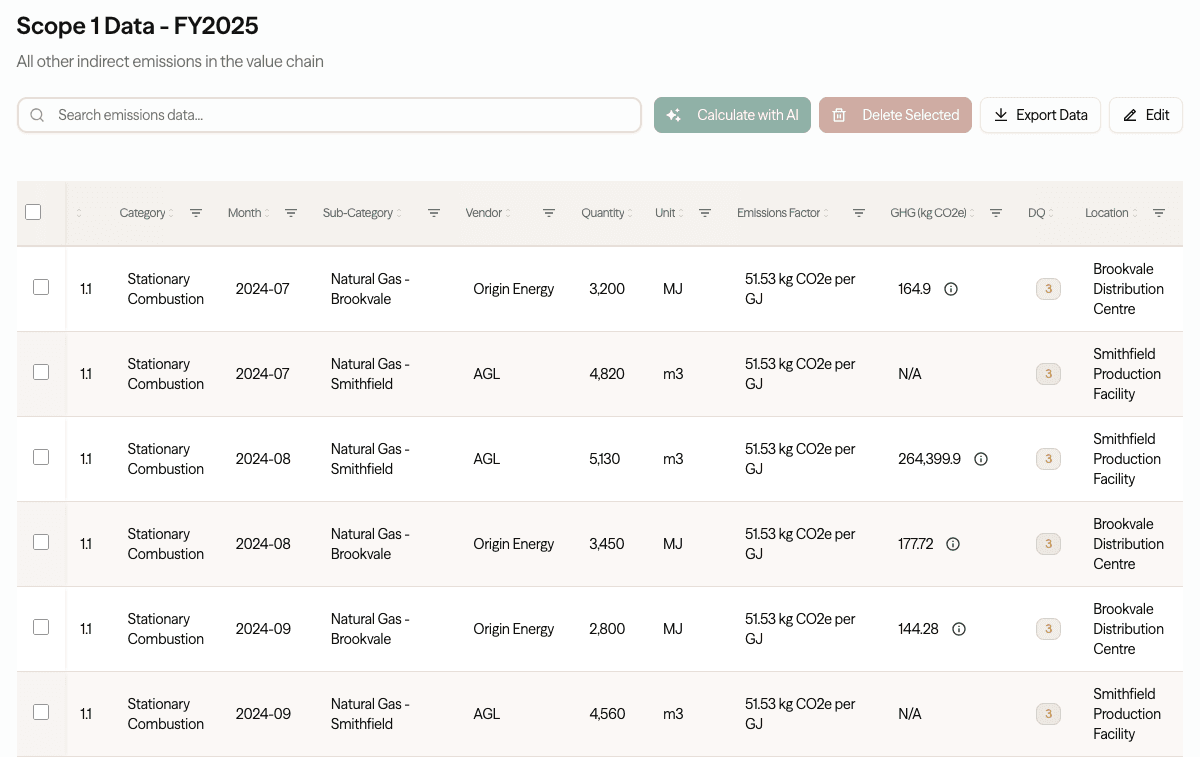
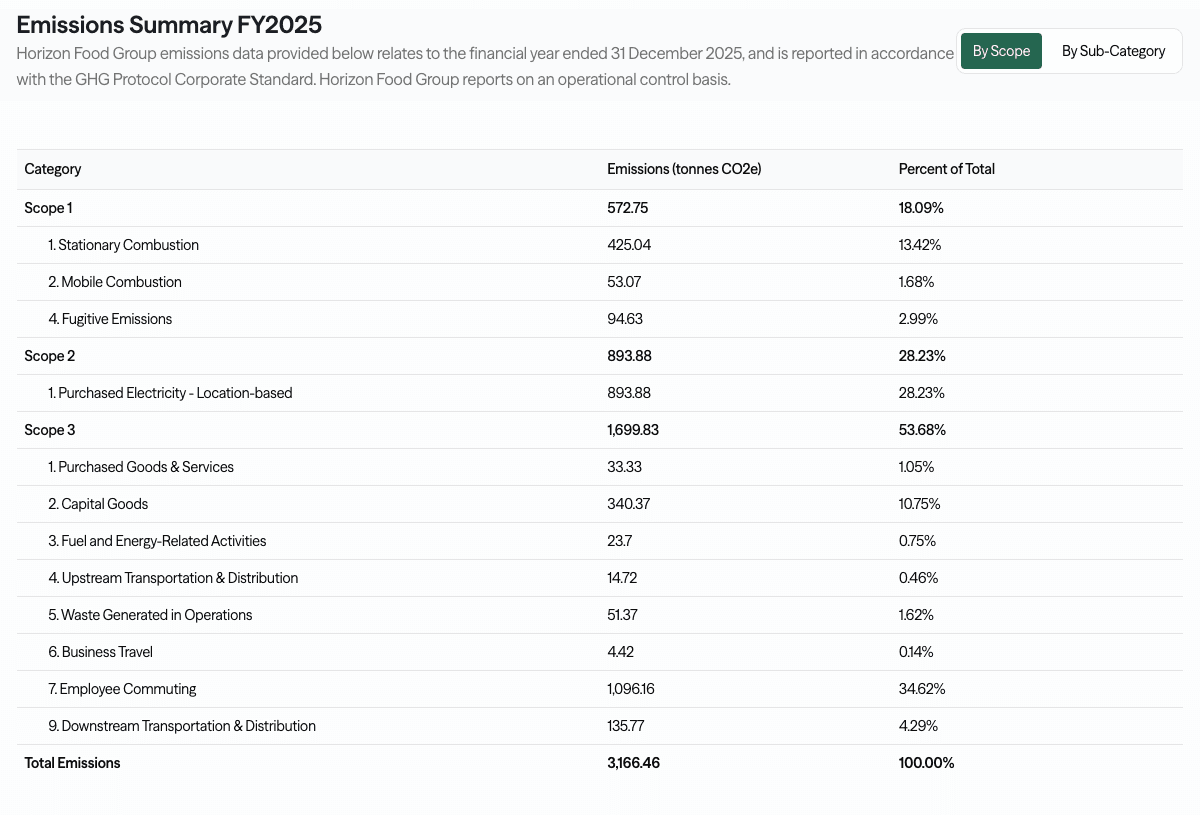
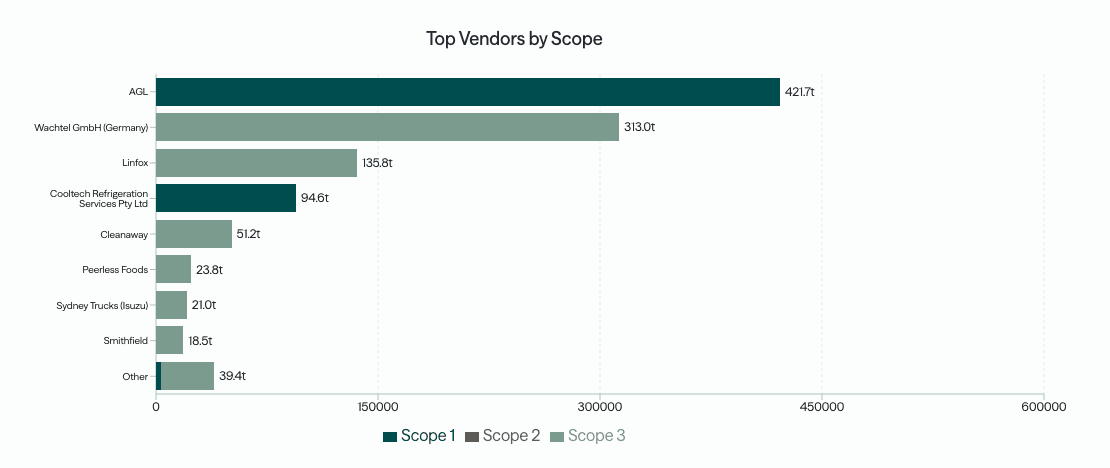 Every number traced to source
See a finished inventory, every number traced to its source
A completed, ASRS-ready example. Every figure linked back to its source document, emissions factor, and reasoning.
Tell us about your team and we'll walk you through this example.
How it works
Drop in fertiliser invoices, head counts, fuel and electricity records, the analyst calculates each scope with matched factors, and you report per enterprise, per paddock or consolidated across the operation.
See the full process →Scope 1 · Livestock
Enteric methane
For most grazing enterprises, enteric fermentation is the single biggest line. CO2 Lab applies the NGER livestock method to your head counts by class, converts methane at a global warming potential of 28, and reports it as a modelled number, because that is what it is.
Head counts by class and days held
NGER livestock method, per animal type
Methane GWP 28 (NGER, AR5 basis)
Modelled, not measured, and labelled
Synthetic nitrogen from fertiliser invoices
IPCC default 1% N → N₂O-N
Nitrous oxide GWP 265 (NGER, AR5 basis)
Direct and indirect soil N₂O separated
Scope 1 · Soil
Fertiliser nitrous oxide
Nitrogen you apply turns into nitrous oxide in the soil, a gas 265 times stronger than carbon dioxide. CO2 Lab takes the applied nitrogen off your fertiliser invoices, applies the IPCC default emission factor, and flags the line as modelled, so your on-farm Scope 1 is honest about what is estimated.
Scope 1 & 2 · Energy
Fuel and electricity
Diesel for machinery and irrigation pumps, and grid electricity for sheds and cold stores, are the metered part of the footprint. CO2 Lab reads fuel deliveries and power bills, applies the current NGA factors, and sits them alongside the modelled biological lines so the whole picture reconciles.
Diesel and petrol for machinery and pumps
Grid electricity by state NGA factor
LPG and on-farm fuel storage
Aligns with SBTi FLAG land-sector targets
Frequently asked questions
A footprint built from your own farm records
A free 30-minute chat, no obligation, on where you stand ahead of your first ASRS report.
Book a Sustainability Check-upWhere to go next
Food & beverage
Ingredients, processing and packaging, the factor shown per line.
MethodologySpend vs activity-based
Which method to use where, and why it changes your Scope 3.
MethodologySupplier engagement
Replace default factors with real data from the firms you rely on.
ComplianceASRS by group
Your reporting group, start date and disclosure requirements.