At a port, the biggest footprint is the marine diesel you burn
At a port the footprint starts with the marine diesel burned by the tugs and pilot boats working the harbour, then runs up the wharf through the cranes and reach stackers. Some of it is metered on bunkering records, some drawn from the grid. The analyst accounts for both the vessels and the landside plant.
You stay the reviewer
Bunkering data in, a defensible number out
The record sits in bunkering and fuel logs for the harbour craft, fuel cards for the terminal plant, and the wharf electricity meters. The analyst reconciles each to the right factor and produces a footprint that traces back to the vessel or the meter it came from.
Emissions line
Marine diesel, harbour tugs, month
Result
160.8 t CO₂e
How the analyst got there
Source
Bunkering records, 60,000 L
Emission factor
NGA 2025, diesel: 2.68 kg CO₂e/L (Scope 1 combustion)
Reasoning
Own craft combustion → Scope 1. Activity-based: bunkered litres.
Bringing experience with SME to Enterprise








99.95%
Calculation accuracy
Per-berth
Emissions tracking
30 min
Average processing time
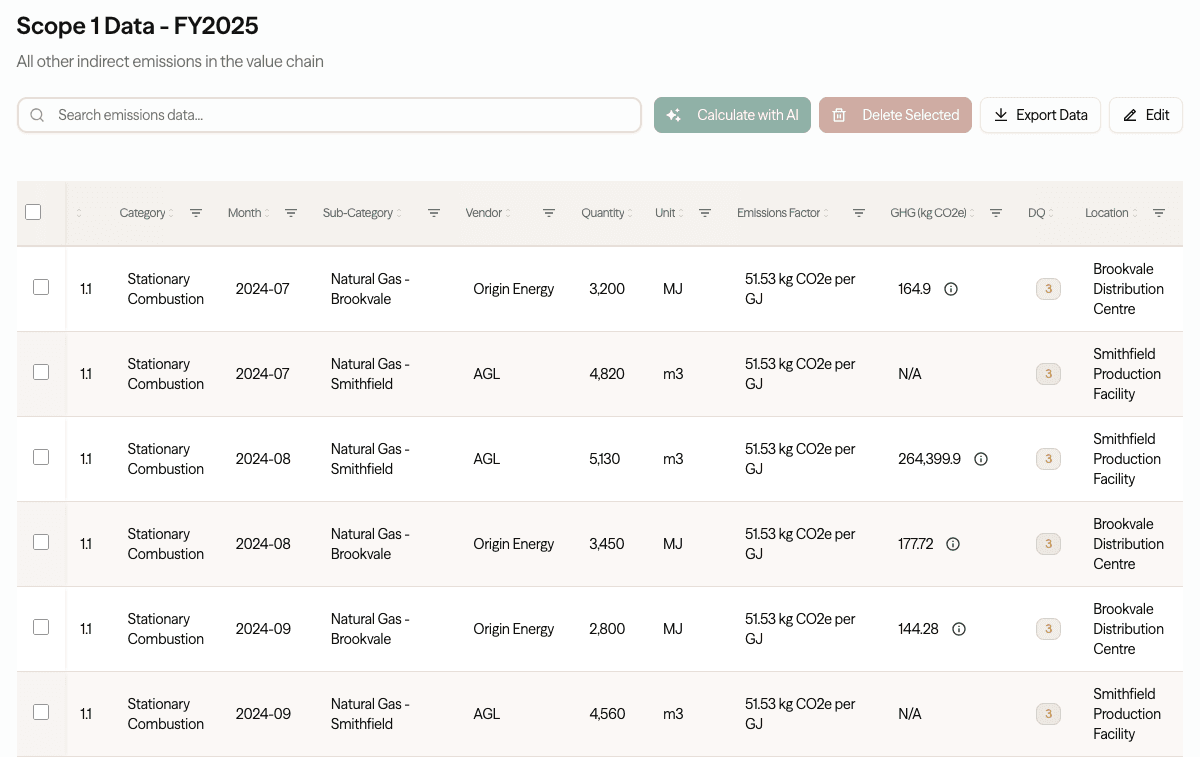
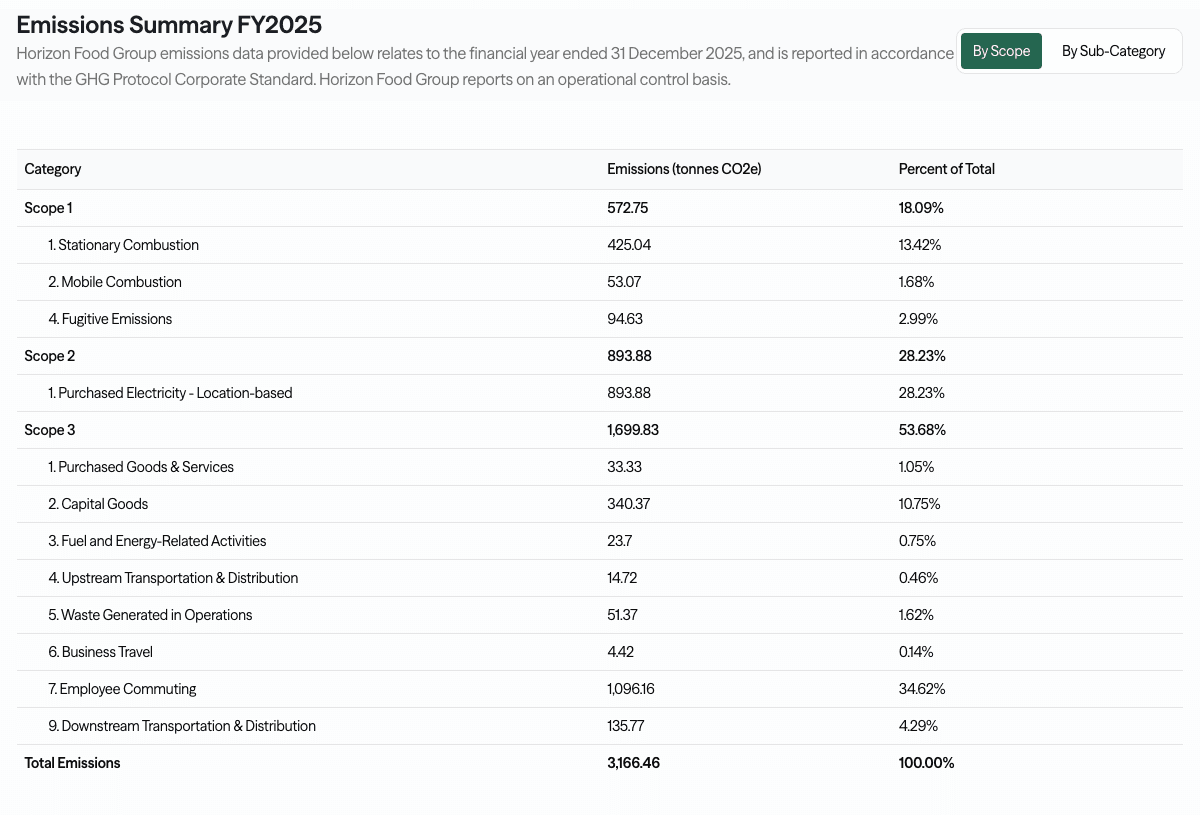
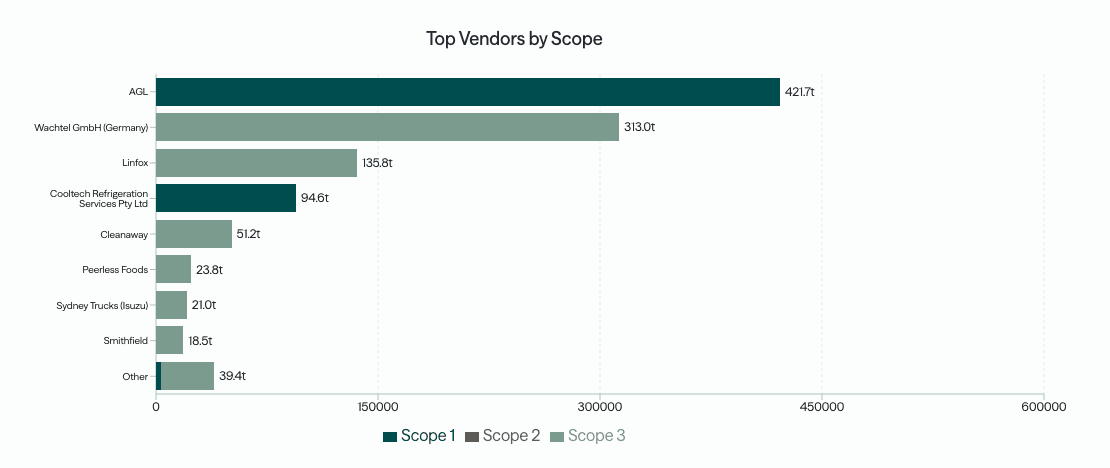 Every number traced to source
See a finished inventory, every number traced to its source
A completed, ASRS-ready example. Every figure linked back to its source document, emissions factor, and reasoning.
Tell us about your team and we'll walk you through this example.
How it works
Drop in bunkering records, plant fuel cards and wharf meters, the analyst calculates each scope with matched factors, and you report per berth, per terminal or consolidated across the port.
See the full process →Scope 1 · Vessels
Harbour craft
Tugs, pilot boats and line boats burn marine diesel, and that fuel is the core of the footprint. CO2 Lab reads bunkering records per vessel, applies the current NGA factor, and reports on a well-to-wheel basis rather than combustion only.
Litres per vessel from bunkering records
Marine diesel and marine gas oil
Well-to-wheel, not combustion only
Heavier marine fuel oils identified by type
Straddle carriers, reach stackers and cranes
Diesel and electric plant separated
Grid electricity by state NGA factor
Location-based and market-based reported
Scope 1 & 2 · Terminal
Terminal plant and power
Container handling plant and wharf power are the landside half. CO2 Lab reads plant diesel and grid electricity, applies the current NGA factors, and treats electric plant and shore power as Scope 2 so an electrification programme shows up as a real reduction.
Scope 3
Shore power and tenants
Power you supply to berthed vessels or to terminal tenants leaves your direct control but stays in your Scope 3. CO2 Lab takes the metered supply and applies matched factors, labelling each line so the number is disclosable and honest.
Shore power supplied to berthed vessels
Electricity on-supplied to tenants
Metered where available, estimated where not
Primary and default data clearly labelled
Frequently asked questions
From harbour craft to the wharf, one footprint
A free 30-minute chat, no obligation, on where you stand ahead of your first ASRS report.
Book a Sustainability Check-upWhere to go next
Logistics
Landside freight, the factor shown per route.
IndustryMining services
Diesel plant and per-contract allocation, the factor per line.
MethodologySpend vs activity-based
Which method to use where, and why it changes your Scope 3.
ComplianceASRS by group
Your reporting group, start date and disclosure requirements.