A property footprint is the energy a building uses, plus the carbon built into it
A property footprint comes in two parts: the energy a building uses year after year, and the carbon built into it the day it goes up or is refurbished. The operating side is on your meters, but the embodied side has to come off a quantity surveyor's report. The analyst accounts for both, so a development year does not quietly distort the trend.
You stay the reviewer
Utility data in, a defensible per-building number out
The inputs sit in different hands: base-building gas and electricity invoices, tenant sub-meters, and the quantity surveyor's report for any fit-out. The analyst brings them onto one basis, matches each to the right factor, and produces a per-asset number that reads consistently with your NABERS rating.
Emissions line
Natural gas, base-building heating, commercial tower, Q2
Result
257.5 t CO₂e
How the analyst got there
Source
Utility invoice, 5,000 GJ
Emission factor
NGA 2025, natural gas: 51.5 kg CO₂e/GJ (Scope 1 combustion)
Reasoning
On-site combustion → Scope 1. Activity-based: metered gas.
Bringing experience with SME to Enterprise








99.95%
Calculation accuracy
Per-building
Emissions tracking
30 min
Average processing time
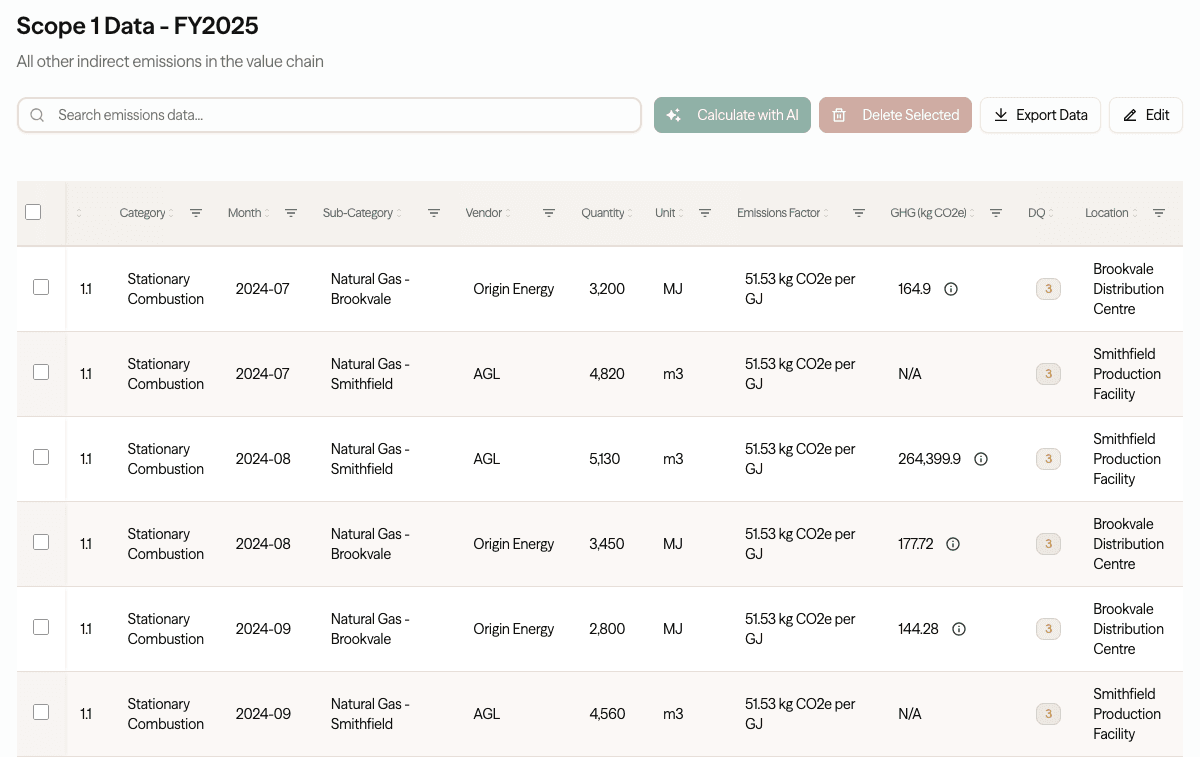
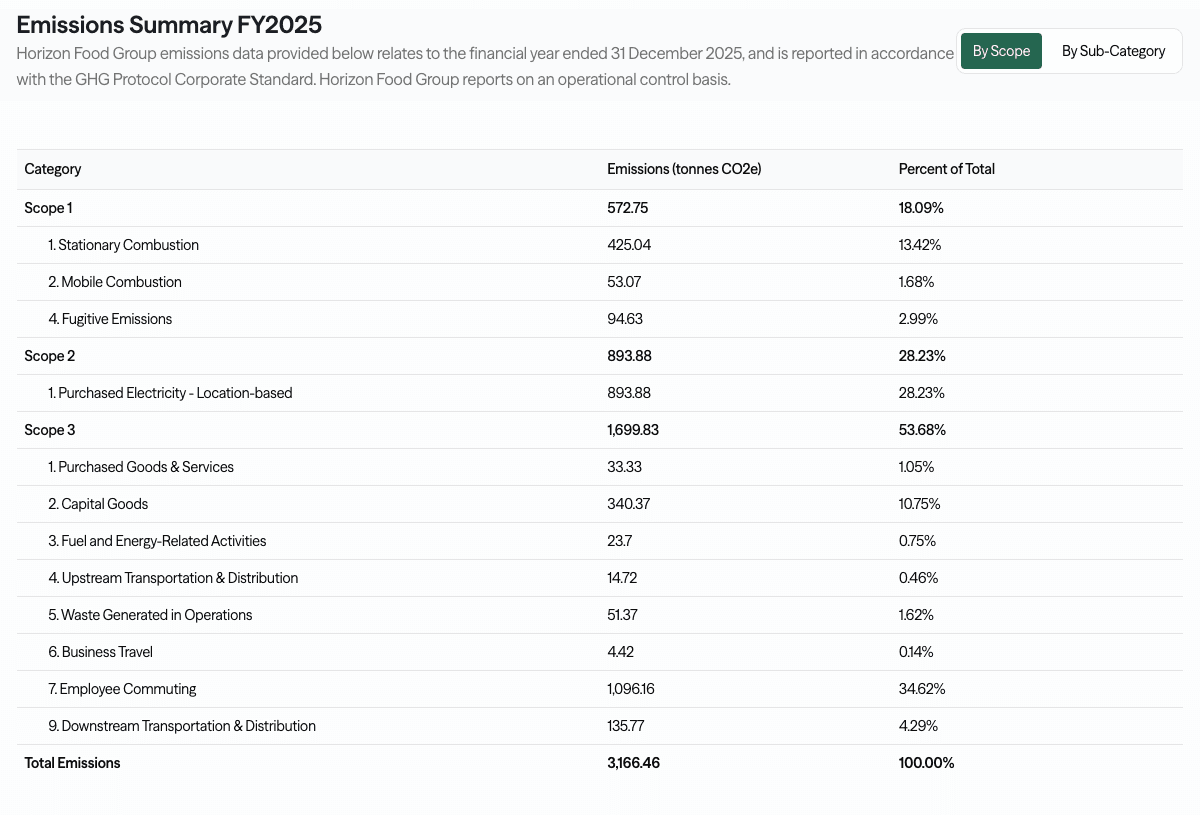
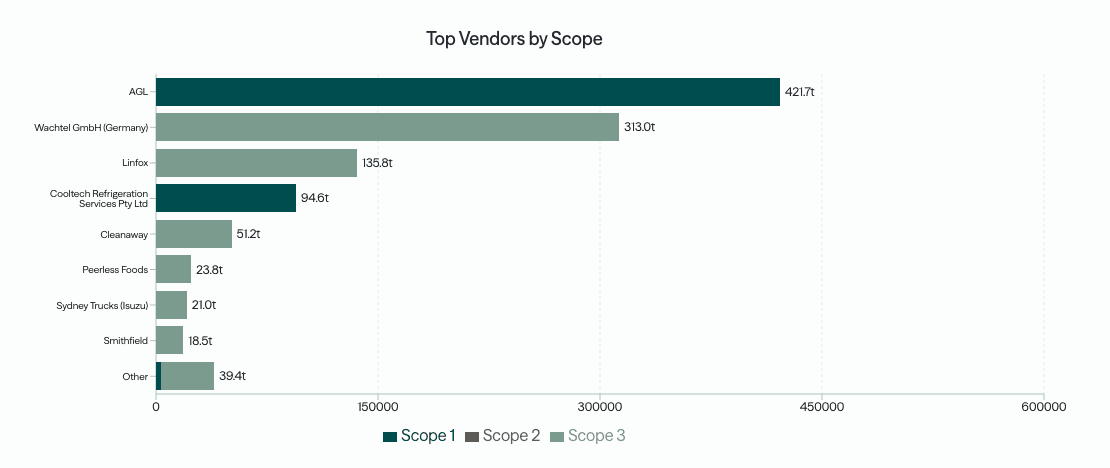 Every number traced to source
See a finished inventory, every number traced to its source
A completed, ASRS-ready example. Every figure linked back to its source document, emissions factor, and reasoning.
Tell us about your team and we'll walk you through this example.
How it works
Drop in base-building and tenant energy, and quantity surveyor reports for capital works, the analyst calculates each scope with matched factors, and you report per building, per fund or consolidated across the portfolio.
See the full process →Scope 1 & 2 · Base building
Operational energy
The energy you control directly, central heating, chillers, common-area power, is the metered core of the footprint. CO2 Lab reads gas and electricity per building, applies the current NGA factors, and reports it on a basis that lines up with your NABERS Energy rating rather than cutting across it.
Natural gas combustion as Scope 1
Grid electricity by state NGA factor
Location-based and market-based reported
Aligns with NABERS Energy coverage
Tenant electricity from sub-meters
Downstream leased assets, Scope 3 Category 13
Estimated where sub-metering is partial
Primary and default data clearly labelled
Scope 3 · Category 13
Tenant energy
The power your tenants use is your Scope 3 as the owner, under downstream leased assets. CO2 Lab takes sub-meter data where it exists and estimates the rest from floor area and benchmarks, labelling clearly which tenancies are measured and which are modelled.
Scope 3 · Category 2
Embodied carbon
A new build or a major refurbishment locks in a large one-off footprint through concrete, steel and fit-out. CO2 Lab takes quantities off the surveyor's report, applies materials factors, and reports embodied carbon as capital goods, so a development year does not quietly distort your operational trend.
Concrete, steel and facade quantities
Materials factors by element
Capital works and fit-outs separated
Aligns with NABERS Embodied Carbon
Frequently asked questions
A footprint for every building you run
A free 30-minute chat, no obligation, on where you stand ahead of your first ASRS report.
Book a Sustainability Check-upWhere to go next
Construction
Embodied carbon at the source, the factor shown per line.
MethodologySpend vs activity-based
Which method to use where, and why it changes your Scope 3.
MethodologySupplier engagement
Replace default factors with real data from the firms you rely on.
ComplianceASRS by group
Your reporting group, start date and disclosure requirements.