For a distributor, the footprint is in the goods you resell
A distributor emits very little itself, and a great deal through the goods it buys to sell on. So when a retail customer asks for emissions data, most of the answer is sitting in the purchase ledger rather than on the power bill. The analyst works it up from that ledger into a number you can hand back.
You stay the reviewer
Your ledger in, a defensible number out
Between the power bills for the distribution centre, the carrier invoices and thousands of purchase lines, the pieces are spread thin. The analyst reconciles the energy site by site, estimates the purchased goods from spend, and produces a number a retail customer can interrogate line by line.
Emissions line
Grid electricity, Sydney distribution centre, Q1
Result
79.2 t CO₂e
How the analyst got there
Source
Retailer invoice, 120,000 kWh
Emission factor
NGA 2025, NSW Scope 2: 0.66 kg CO₂e/kWh (location-based)
Reasoning
Purchased electricity → Scope 2. Activity-based: metered kWh.
Bringing experience with SME to Enterprise








99.95%
Calculation accuracy
Per-site
Emissions tracking
30 min
Average processing time
 Every number traced to source
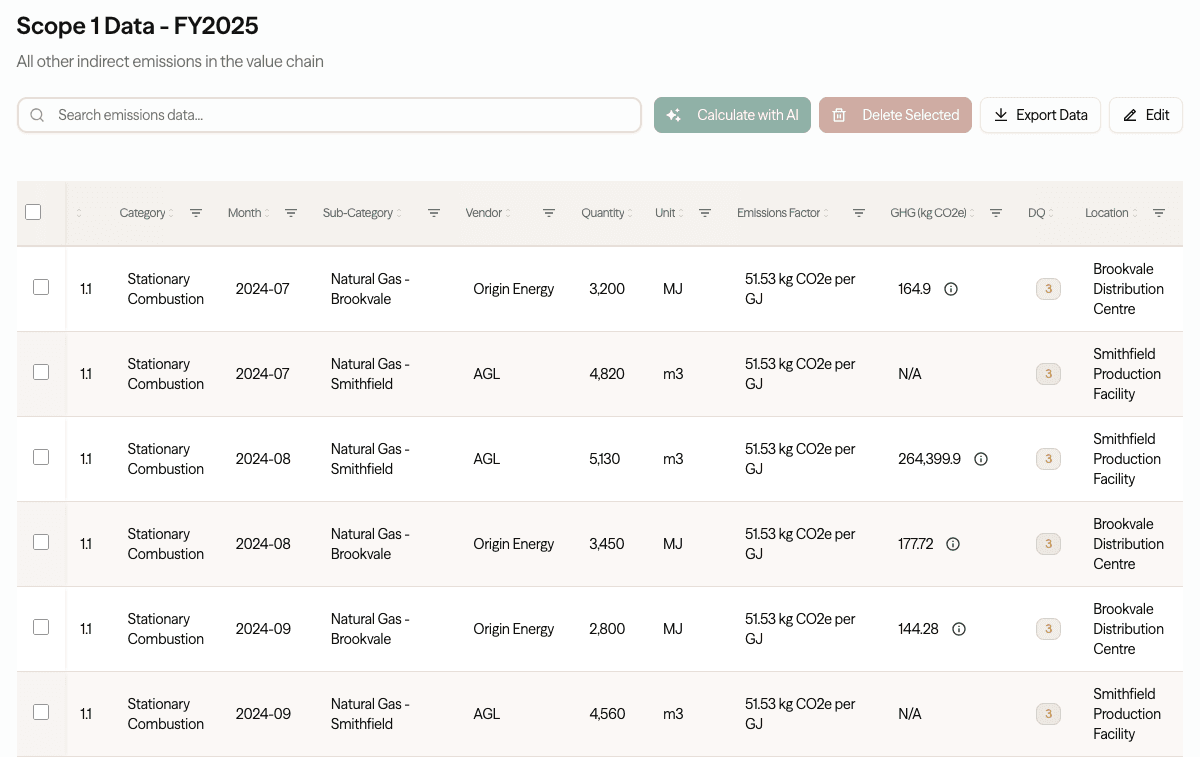
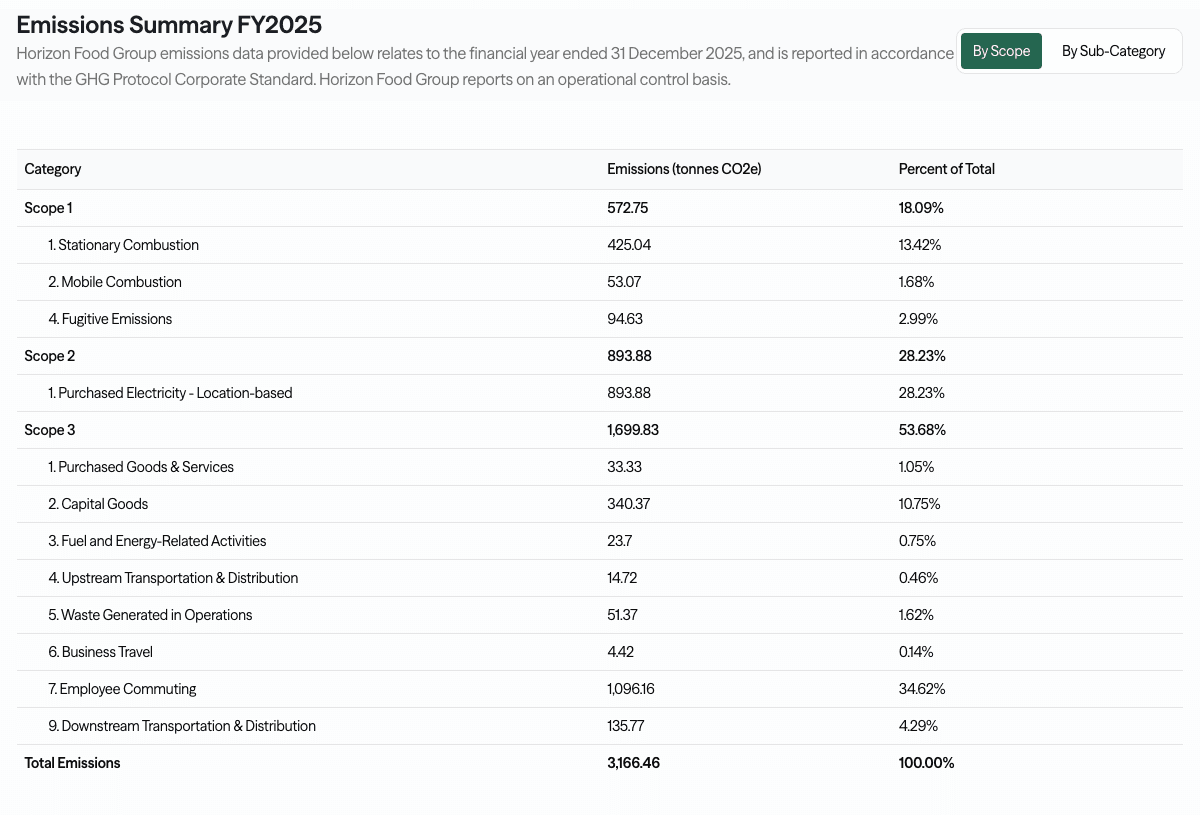
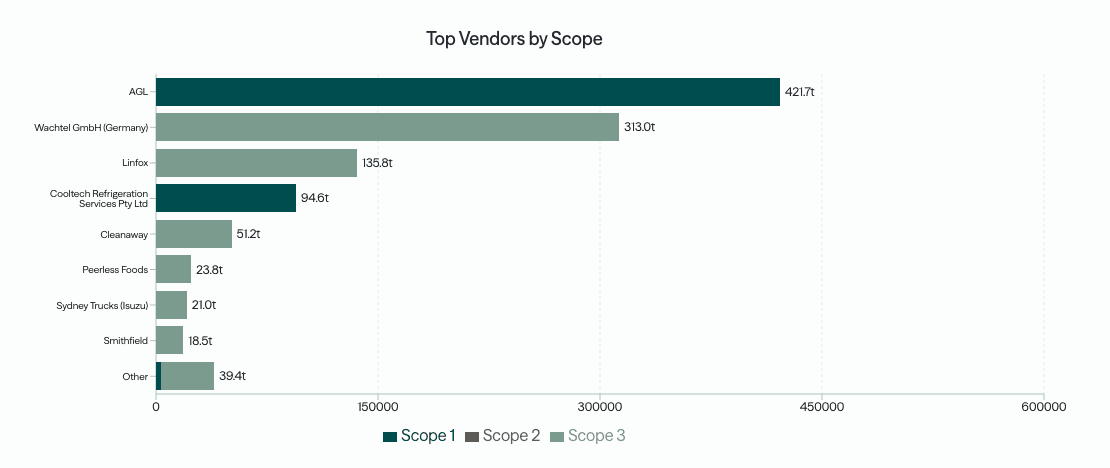
See a finished inventory, every number traced to its source
A completed, ASRS-ready example. Every figure linked back to its source document, emissions factor, and reasoning.
Tell us about your team and we'll walk you through this example.
How it works
Drop in power bills, carrier invoices and your purchase ledger, the analyst calculates each scope with matched factors, and you report per site, per customer or consolidated across the business.
See the full process →Scope 2 · Sites
Warehouse energy
Distribution centres, cold stores and forklifts are the metered part of the footprint. CO2 Lab reads power bills per site, applies the current NGA Scope 2 factor for each state grid, and reports location-based and market-based side by side.
Grid electricity by state NGA factor
Location-based and market-based reported
Refrigerant top-ups as fugitive Scope 1
Forklift LPG and site fuel
Purchase ledger by product category
Spend-based estimate to start, labelled
Supplier-specific factors where available
Reconciled so nothing is counted twice
Scope 3 · Category 1
Goods for resale
The stock you buy to sell on is usually the largest part of a distributor's footprint, and the hardest to source. CO2 Lab starts from your purchase ledger with spend-based factors, then swaps in supplier-specific data as it arrives, and labels every line so you can see what is estimated and what is real.
Scope 3 · Distribution
Outbound freight
Moving stock to customers on carriers you hire sits in your Scope 3. CO2 Lab takes the weight, distance and mode off your consignments and applies GLEC and ISO 14083 intensities, flagging where the number is a default rather than carrier-measured.
Outbound distribution to customers
Weight, distance and mode from consignments
GLEC and ISO 14083 default intensities
Primary and default data clearly labelled
Frequently asked questions
The number your retail customers are asking for
A free 30-minute chat, no obligation, on where you stand ahead of your first ASRS report.
Book a Sustainability Check-up