A data centre's footprint is electricity, and the grid it draws from
A data centre's footprint is almost all electricity, split between the IT load and the cooling that keeps it from overheating. Which grid that power comes from decides the number as much as how much you draw, and your colocation customers increasingly want their share of it. The analyst works it out from your power and PUE data.
You stay the reviewer
Meter data in, a defensible per-facility number out
Most of it is already on your meters: total facility power, IT load, the generator test runs and the refrigerant logs. The analyst applies the right state grid factor, separates location-based from market-based, and produces a per-facility number a customer can rely on.
Emissions line
Grid electricity, facility total, quarter
Result
3,300 t CO₂e
How the analyst got there
Source
Retailer invoice, 5,000,000 kWh
Emission factor
NGA 2025, NSW Scope 2: 0.66 kg CO₂e/kWh (location-based)
Reasoning
Purchased electricity → Scope 2. Activity-based: metered kWh.
Bringing experience with SME to Enterprise








99.95%
Calculation accuracy
Per-facility
Emissions tracking
30 min
Average processing time
 Every number traced to source
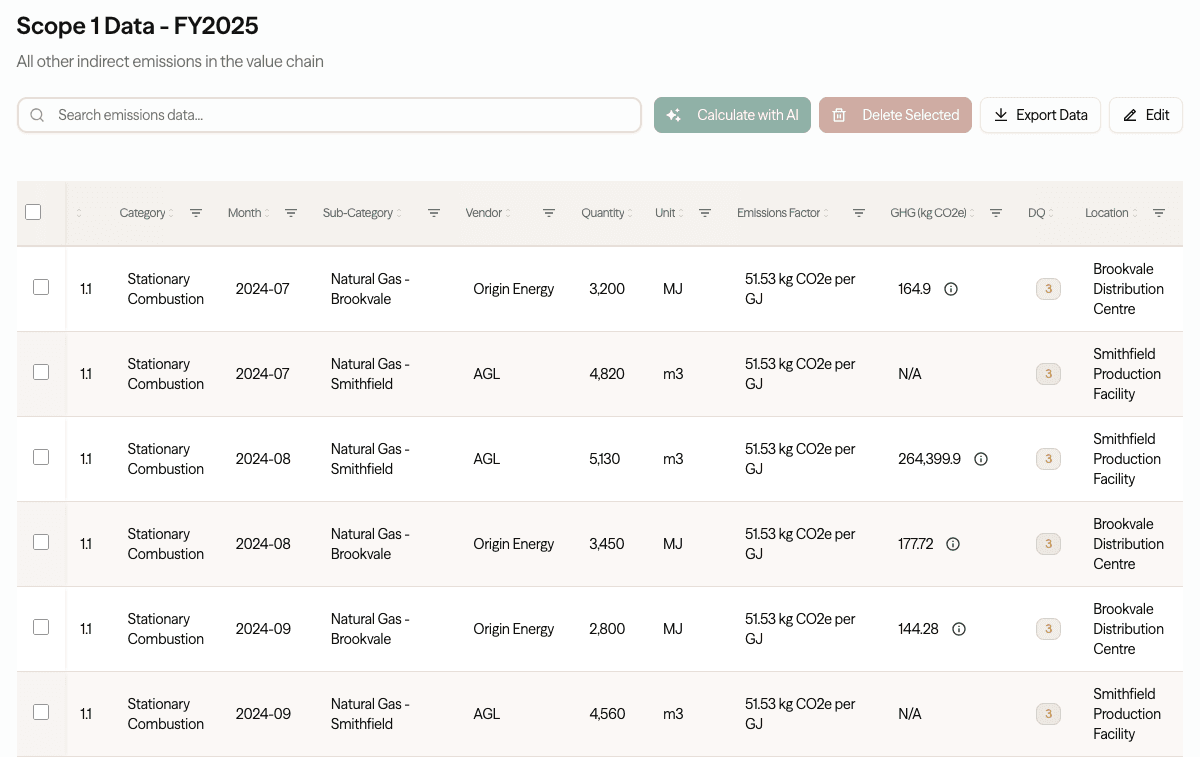
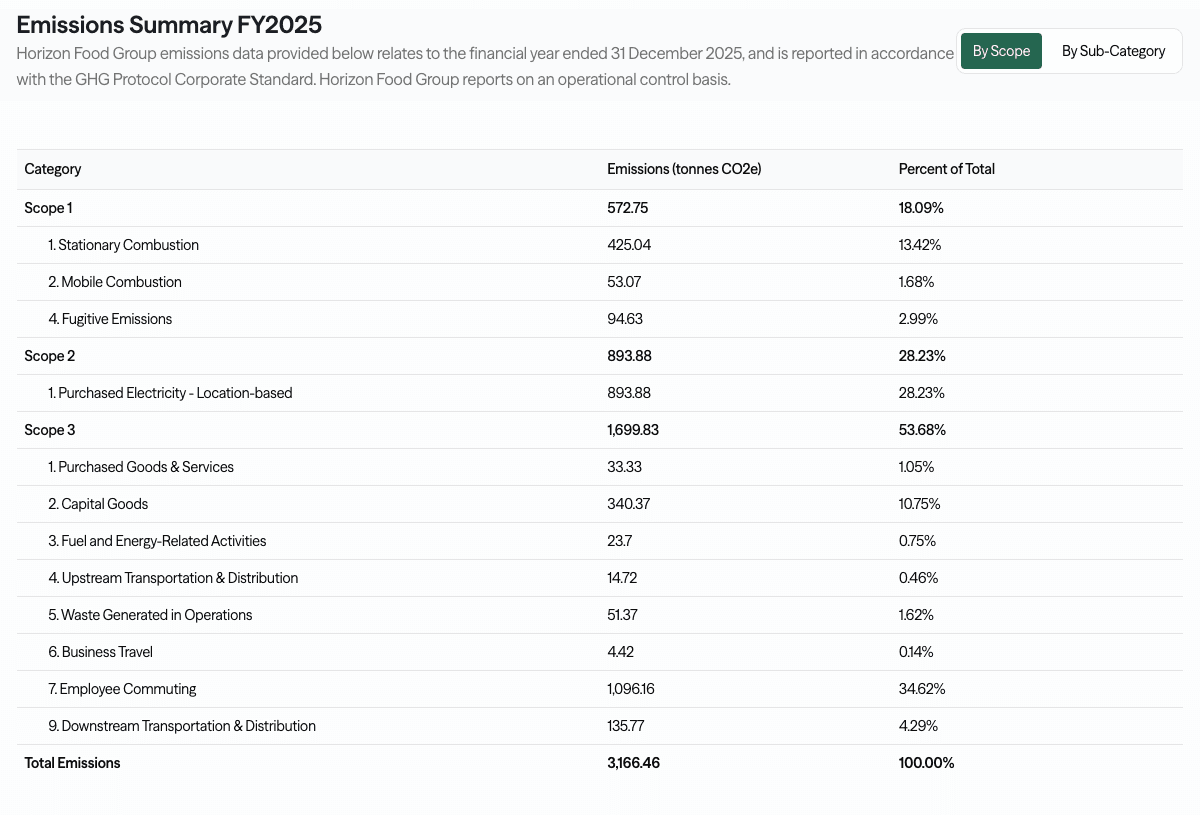
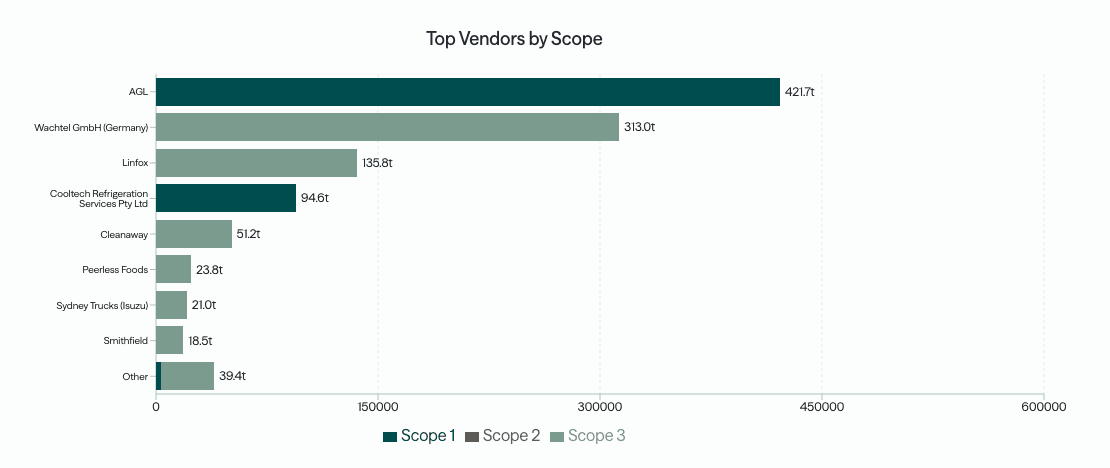
See a finished inventory, every number traced to its source
A completed, ASRS-ready example. Every figure linked back to its source document, emissions factor, and reasoning.
Tell us about your team and we'll walk you through this example.
How it works
Drop in facility power, IT load, generator logs and refrigerant records, the analyst calculates each scope with matched factors, and you report per facility, per customer or consolidated across the estate.
See the full process →Scope 2 · Electricity
IT load and cooling
The IT load plus the cooling to remove its heat is almost the whole footprint. CO2 Lab reads total facility power, relates it to IT load through your PUE, applies the current NGA state factor, and reports location-based and market-based side by side so a renewable contract shows up honestly.
Total facility power and IT load
Power usage effectiveness (PUE) reported
Grid electricity by state NGA factor
Location-based and market-based reported
Generator diesel from test and run hours
Refrigerant top-ups as fugitive Scope 1
High-GWP refrigerants identified by type
Primary and default data clearly labelled
Scope 1 · On-site
Backup and refrigerant
Standby generators and the refrigerant in the cooling plant are the small but real Scope 1. CO2 Lab reads diesel from generator run hours and refrigerant top-ups from maintenance logs, identifies the high global warming potential gases, and keeps them separate from the grid power.
For your customers
Per-customer allocation
A colocation customer's footprint from you is their Scope 3, so a single facility total is not enough. CO2 Lab allocates power to each customer by rack or metered draw, so you can hand each one their slice with the working attached, and make their reporting easier rather than harder.
Power allocated per customer by rack or meter
Your Scope 2 becomes their Scope 3
Reported in the customer requested format
Source and factor shown, ready for assurance
Frequently asked questions
The number your colocation customers want
A free 30-minute chat, no obligation, on where you stand ahead of your first ASRS report.
Book a Sustainability Check-upWhere to go next
Property
Building energy and embodied carbon, the factor shown per line.
IntegrationClaude & ChatGPT
Ask the analyst for a number and get the working back.
MethodologySupplier engagement
Hand your customers real data instead of an estimate.
ComplianceASRS by group
Your reporting group, start date and disclosure requirements.