A campus footprint is the buildings, and how everyone gets there
A campus runs like a small city, but the energy on its meters is rarely the biggest line. For most institutions the larger footprint is the thousands of students and staff commuting in, and everything the campus procures. The analyst accounts for the buildings, the travel and the supply chain together.
You stay the reviewer
Campus data in, a defensible number out
The inputs span the whole campus: energy invoices across many buildings, fleet fuel, and the travel survey behind the commuting estimate. The analyst matches each to the right factor and produces a footprint you can defend to an assurer or a ranking body.
Emissions line
Grid electricity, main campus, quarter
Result
528 t CO₂e
How the analyst got there
Source
Retailer invoice, 800,000 kWh
Emission factor
NGA 2025, NSW Scope 2: 0.66 kg CO₂e/kWh (location-based)
Reasoning
Purchased electricity → Scope 2. Activity-based: metered kWh.
Bringing experience with SME to Enterprise








99.95%
Calculation accuracy
Per-campus
Emissions tracking
30 min
Average processing time
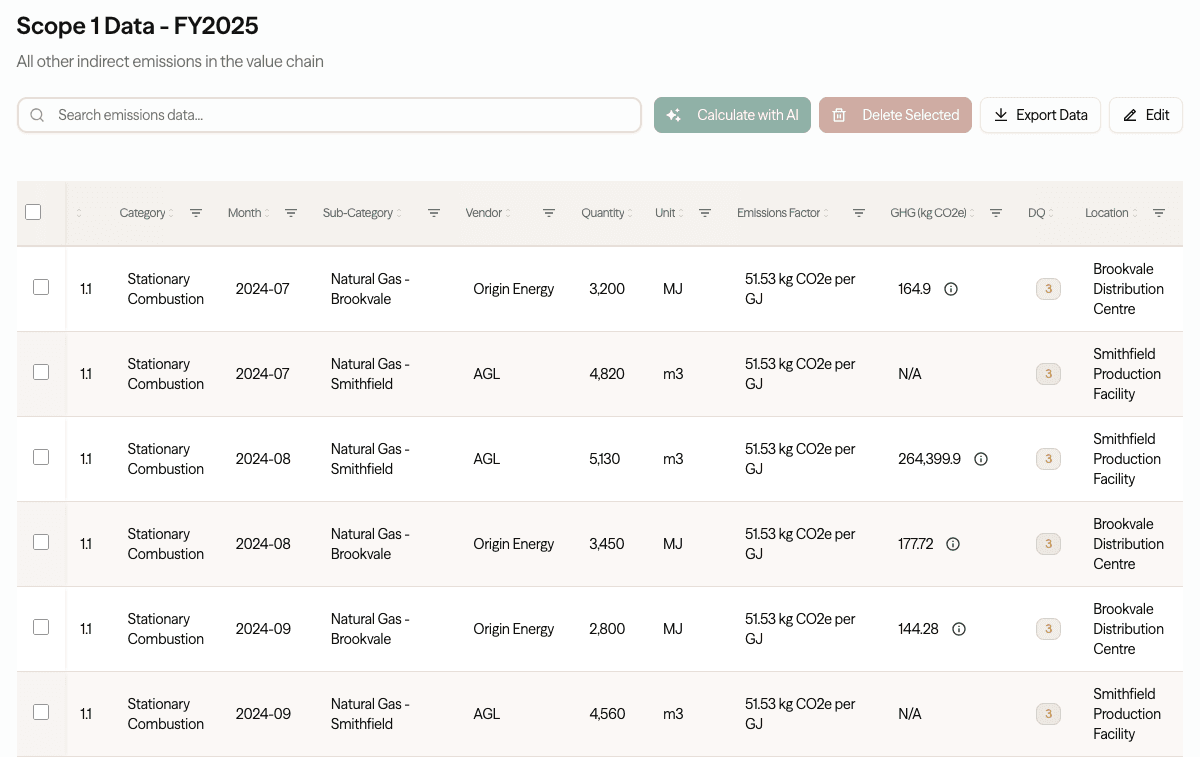
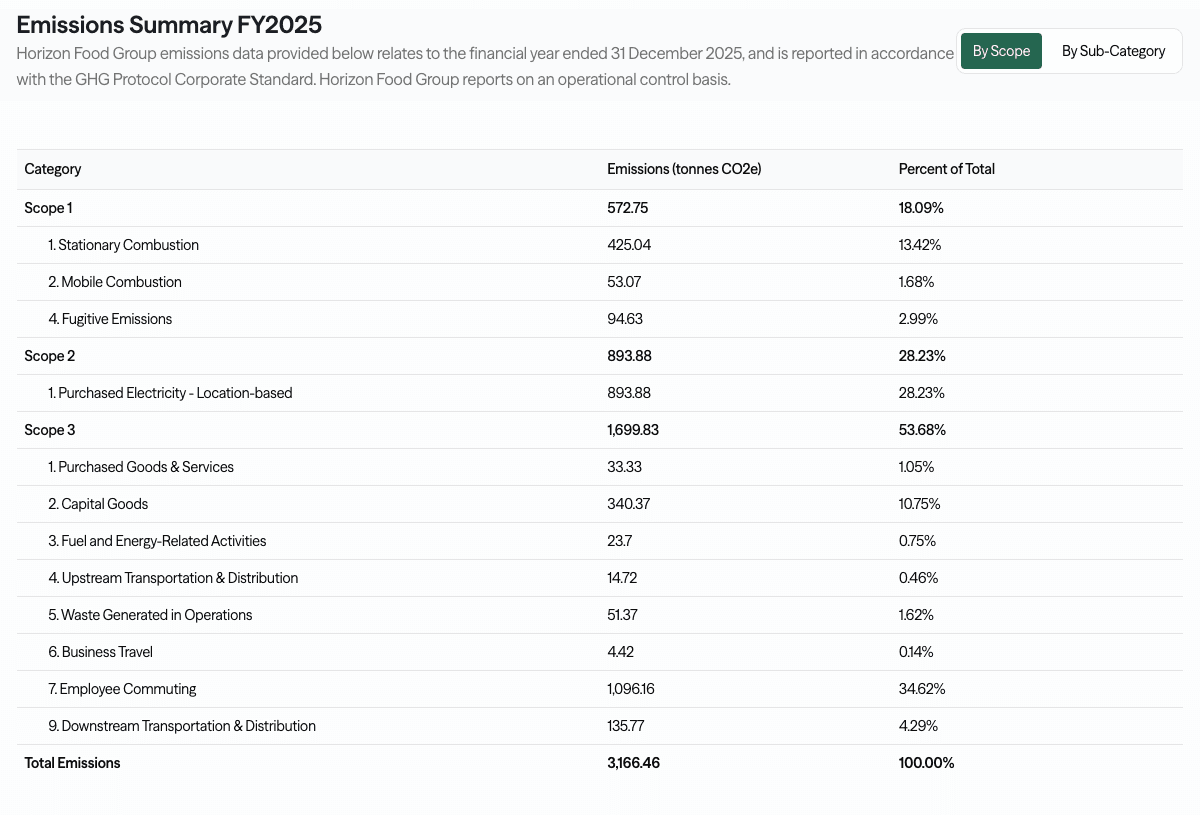
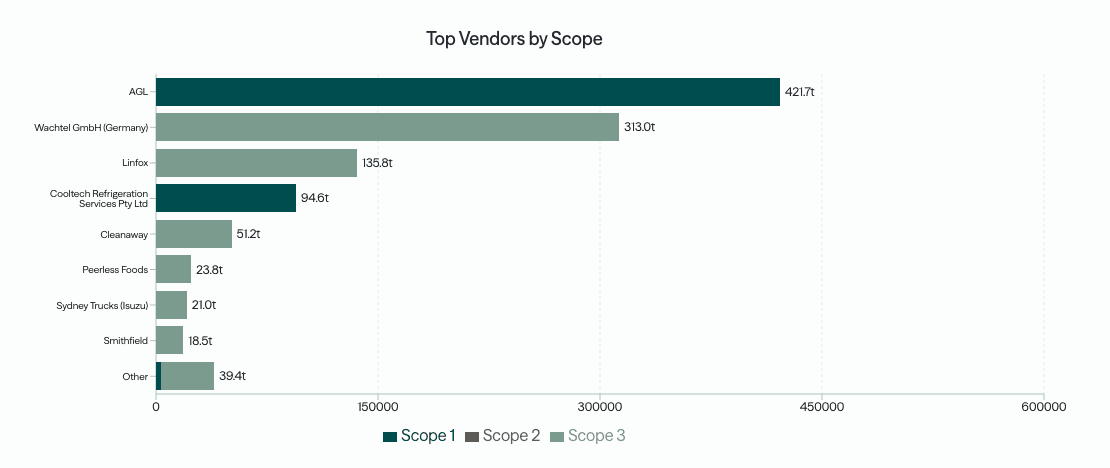 Every number traced to source
See a finished inventory, every number traced to its source
A completed, ASRS-ready example. Every figure linked back to its source document, emissions factor, and reasoning.
Tell us about your team and we'll walk you through this example.
How it works
Drop in energy invoices, fleet fuel, commuting surveys and procurement spend, the analyst calculates each scope with matched factors, and you report per campus, per faculty or consolidated across the institution.
See the full process →Scope 1 & 2 · Campus
Buildings and fleet
Lecture theatres, labs, residences and a grounds fleet are the metered core. CO2 Lab reads electricity, gas and fuel per building and vehicle, applies the current NGA factors, and reports location-based and market-based electricity side by side.
Grid electricity by state NGA factor
Natural gas for heating and labs
Grounds and shuttle fleet fuel
Location-based and market-based reported
Student and staff commuting, Scope 3 Category 7
Mode split from travel surveys
Estimated where survey data is partial
Primary and default data clearly labelled
Scope 3 · Category 7
Commuting
Thousands of people travelling to campus is often larger than the buildings themselves. CO2 Lab takes mode split off your travel surveys, applies the right factors, and labels the line as modelled, so a dominant but estimated source is disclosed honestly rather than left out.
Scope 3 · Category 1
Procurement
Research equipment, IT, construction and services add up across a large institution. CO2 Lab starts from procurement spend with spend-based factors, swaps in supplier data as it arrives, and labels every line so you can see what is estimated and what is real.
Procurement spend by category
Spend-based estimate to start, labelled
Supplier-specific factors where available
Reconciled so nothing is counted twice
Frequently asked questions
A defensible footprint for the whole campus
A free 30-minute chat, no obligation, on where you stand ahead of your first ASRS report.
Book a Sustainability Check-upWhere to go next
Property
Building energy and embodied carbon, the factor shown per line.
MethodologySpend vs activity-based
Which method to use where, and why it changes your Scope 3.
MethodologySupplier engagement
Replace spend estimates with real supplier data.
ComplianceASRS by group
Your reporting group, start date and disclosure requirements.