A council's emissions are spread across hundreds of sites and services
A council's emissions are scattered across pools, libraries, a works fleet and, very often, a landfill that keeps emitting for years. The data lives in dozens of systems, and the report has to stand up to public scrutiny. The analyst consolidates it into one number a resident or auditor could follow back to its source.
You stay the reviewer
Your systems in, a defensible public number out
The inputs are spread across dozens of systems: energy invoices for many sites, fleet fuel cards, weighbridge tonnages and procurement spend. The analyst brings them onto one basis, matches each to the right factor, and produces a number that holds up to public scrutiny and audit.
Emissions line
Grid electricity, aquatic centre, quarter
Result
217.8 t CO₂e
How the analyst got there
Source
Retailer invoice, 330,000 kWh
Emission factor
NGA 2025, NSW Scope 2: 0.66 kg CO₂e/kWh (location-based)
Reasoning
Purchased electricity → Scope 2. Activity-based: metered kWh.
Bringing experience with SME to Enterprise








99.95%
Calculation accuracy
Per-facility
Emissions tracking
30 min
Average processing time
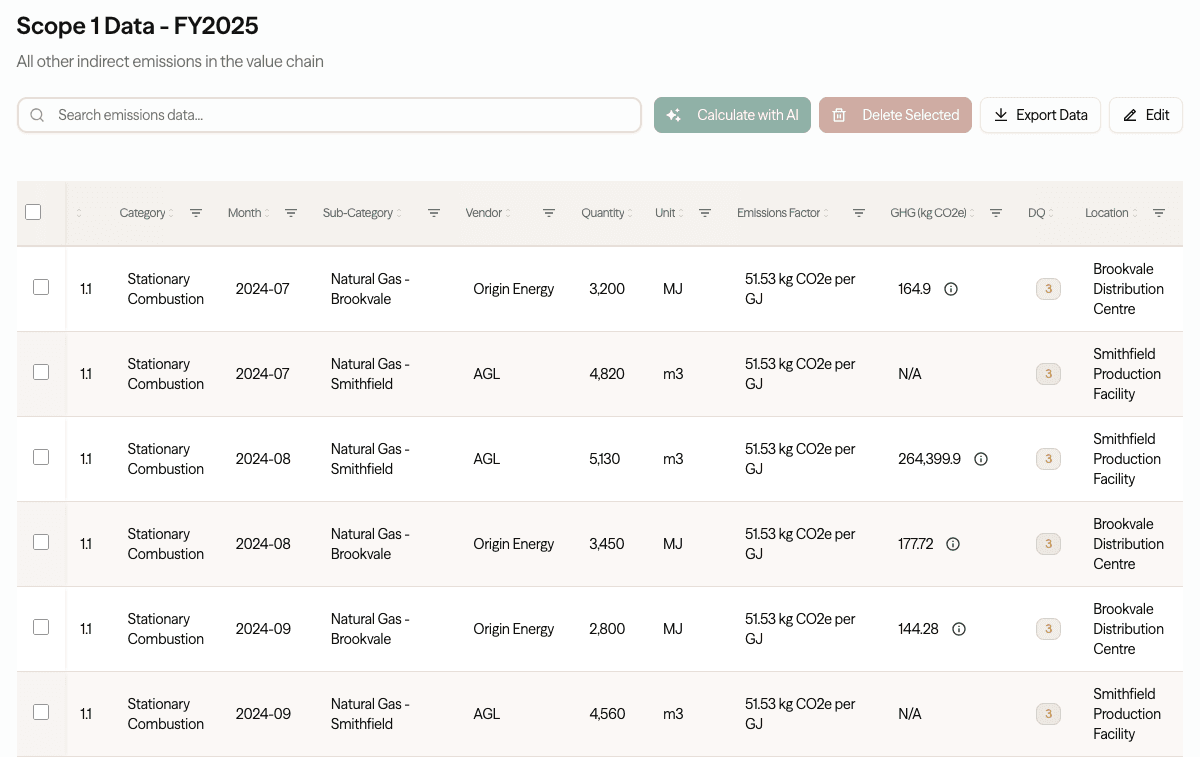
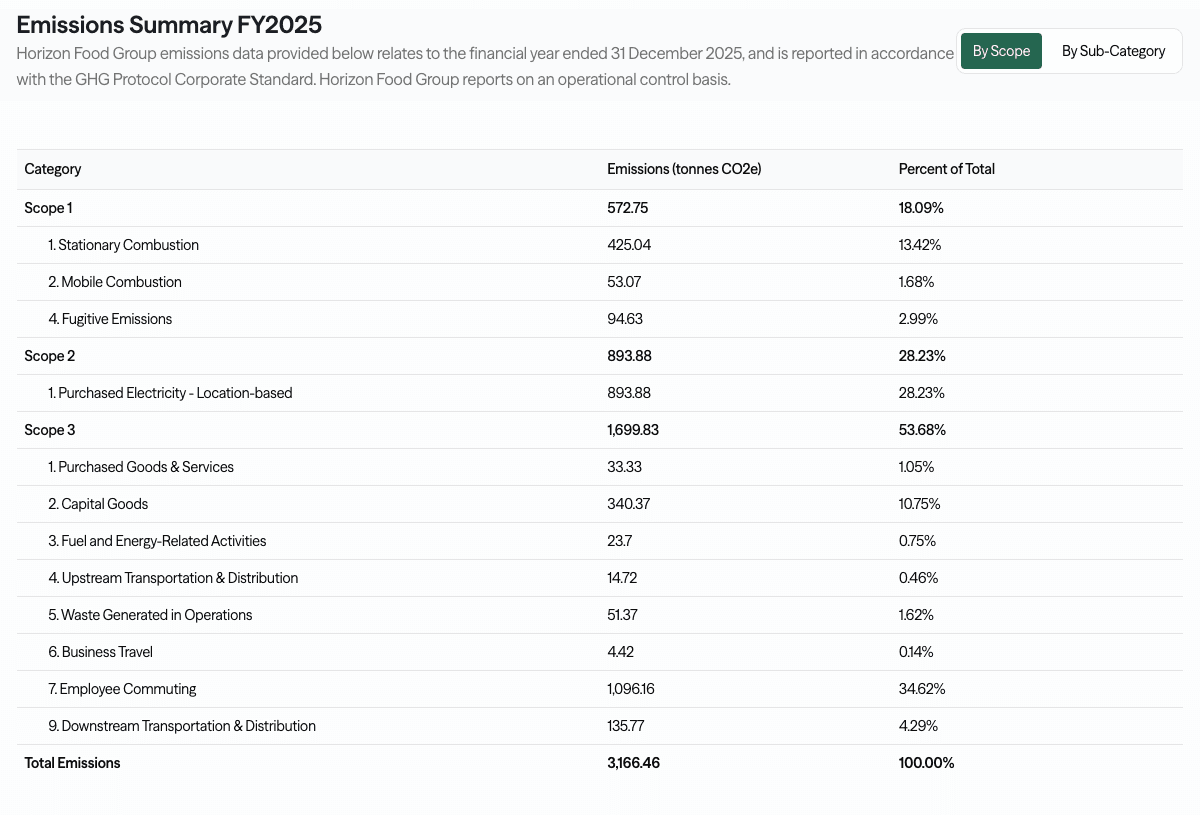
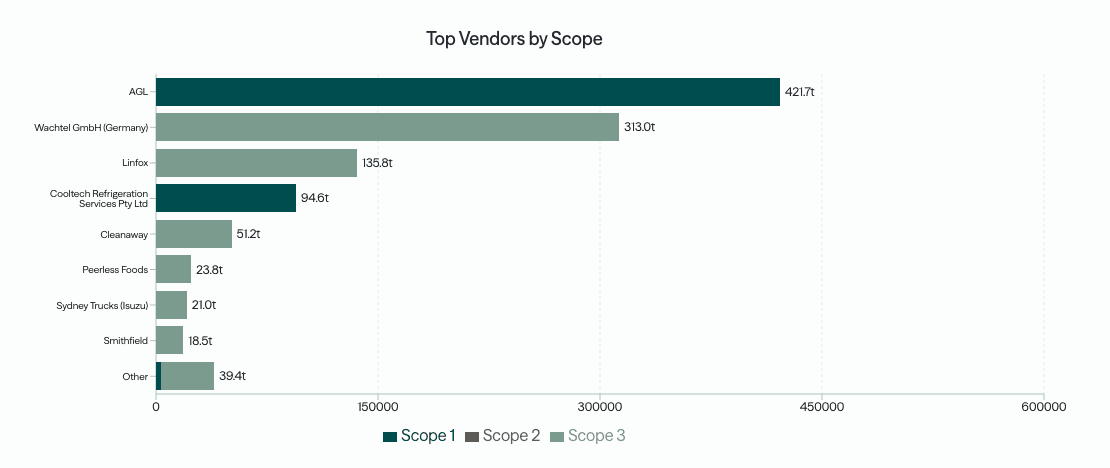 Every number traced to source
See a finished inventory, every number traced to its source
A completed, ASRS-ready example. Every figure linked back to its source document, emissions factor, and reasoning.
Tell us about your team and we'll walk you through this example.
How it works
Drop in energy invoices, fleet fuel, weighbridge tonnages and procurement spend, the analyst calculates each scope with matched factors, and you report per facility, per directorate or consolidated across the organisation.
See the full process →Scope 1 & 2 · Operations
Facilities and fleet
Pools, libraries, depots and street lighting draw power, and the works fleet burns diesel. CO2 Lab reads energy and fuel per site and vehicle, applies the current NGA factors, and reports location-based and market-based electricity side by side.
Grid electricity by state NGA factor
Natural gas and street lighting
Works fleet and plant diesel
Location-based and market-based reported
Putrescible tonnages from the weighbridge
NGER landfill gas method, first-order decay
Methane GWP 28 (NGER, AR5 basis)
Gas captured and flared netted off, and labelled
Scope 1 · Landfill gas
Council landfill
A council that runs a landfill carries years of methane from waste already tipped. CO2 Lab applies the NGER landfill gas method to your weighbridge tonnages, converts methane at a global warming potential of 28, nets off capture and flaring, and flags the line as modelled rather than measured.
Scope 3 · Category 1 & 2
Procurement and works
Contracted services, road and infrastructure works, and goods add up across a large organisation. CO2 Lab starts from procurement spend with spend-based factors, swaps in supplier data as it arrives, and labels every line so the estimate is transparent.
Procurement and contracted services spend
Road, infrastructure and capital works
Spend-based estimate to start, labelled
Supplier-specific factors where available
Frequently asked questions
A public number that stands up to scrutiny
A free 30-minute chat, no obligation, on where you stand with your emissions reporting.
Book a Sustainability Check-upWhere to go next
Waste & recycling
Collection fleet and landfill methane, the factor per line.
IndustryProperty
Building energy and embodied carbon, the factor per line.
MethodologySupplier engagement
Replace spend estimates with real supplier data.
ComplianceASRS by group
Your reporting group, start date and disclosure requirements.